Answered step by step
Verified Expert Solution
Link Copied!

Question

1 Approved Answer

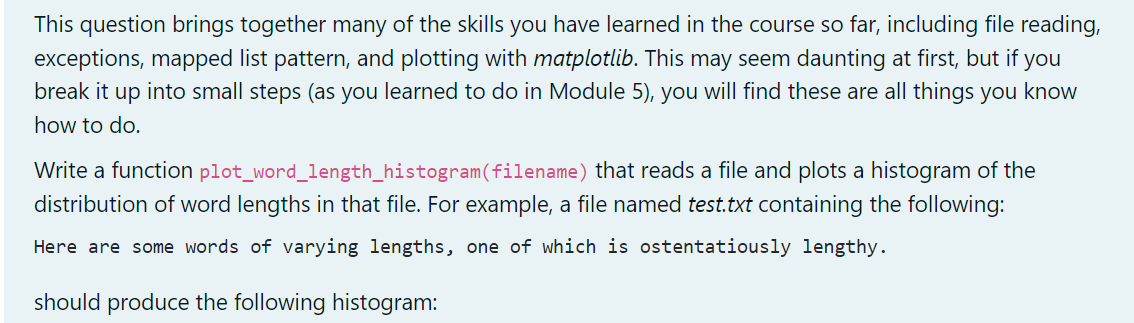
Python Language question This question brings together many of the skills you have learned in the course so far, including file reading, exceptions, mapped list

Python Language question

image text in transcribedimage text in transcribedimage text in transcribed

This question brings together many of the skills you have learned in the course so far, including file reading, exceptions, mapped list pattern, and plotting with matplotlib. This may seem daunting at first, but if you break it up into small steps (as you learned to do in Module 5), you will find these are all things you know how to do. Write a function plot_word_length_histogram(filename) that reads a file and plots a histogram of the distribution of word lengths in that file. For example, a file named test.txt containing the following: Here are some words of varying lengths, one of which is ostentatiously lengthy. should produce the following histogram: Word lengths in test.txt 3.0 2.5 2.0 Number of words 1.5 1.0 0.5 0.0 + 2 0 4 6 8 14 16 18 18 20 10 12 Word length Once you have stored the whole contents of the file (as a string) in the variable contents, you should extract the words using: words = re.findall('[a-zA-Z]+', contents) You will need to import re (re is the Regular Expression module) at the start of your code and include it when you submit your code on the Quiz Server. You are not expected to understand the line involving the use of re. Requirements: If your function receives an invalid filename, it should catch the exception and print the message "The file {filename} was not found." where {filename} is the name of the file given to the function. The title should be "Word lengths in {filename}", where (filename} is the name of the file given to the function. The x-label and y-label should be "Word length" and "Number of words" respectively. You should set the x-ticks explicitly from 0 to 20 (inclusive) in steps of 2. The bins should each be 1 wide, starting at 1 and finishing at 20 (inclusive). You must set these bins explicitly. It is not a density plot - the vertical axis displays a count of how many words are in each bin. Your plot must have grid lines. Rather than writing one giant function that does lots of different things, you should write helper functions that plot_word_length_histogram(filename) calls to perform specific tasks. None of your functions can take more than two input parameters or have more than 10 statements

Step by Step Solution

There are 3 Steps involved in it

Step: 1

blur-text-image

Get Instant Access to Expert-Tailored Solutions

See step-by-step solutions with expert insights and AI powered tools for academic success

Step: 2

blur-text-image

Step: 3

blur-text-image

Ace Your Homework with AI

Get the answers you need in no time with our AI-driven, step-by-step assistance

Get Started

Recommended Textbook for

Intelligent Databases Technologies And Applications

Authors: Zongmin Ma

1st Edition

1599041219, 978-1599041216

More Books

Students also viewed these Databases questions