Answered step by step
Verified Expert Solution
Link Copied!

Question

1 Approved Answer

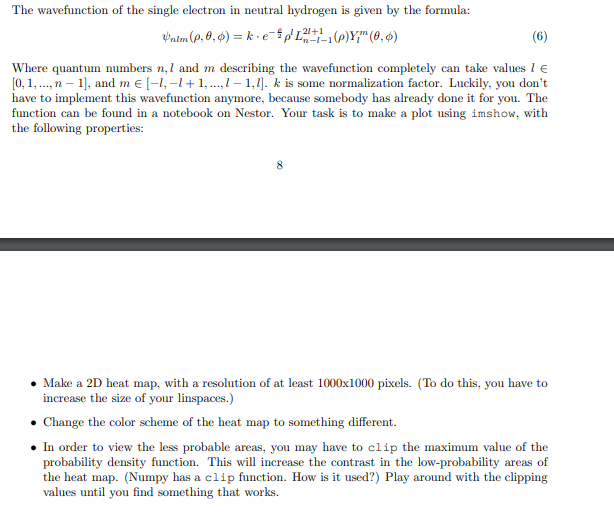
Python matplotlib The wavefunction of the single electron in neutral hydrogen is given by the formula: Unim(p, 0,6)=k.e-5p 22-1-1 (p)Y (0,0) (6) Where quantum numbers

Python matplotlib

image text in transcribed

The wavefunction of the single electron in neutral hydrogen is given by the formula: Unim(p, 0,6)=k.e-5p 22-1-1 (p)Y" (0,0) (6) Where quantum numbers n, l and m describing the wavefunction completely can take values le f0.1,..., n-1), and m e -1,-1+1,...,1-1,2). k is some normalization factor. Luckily, you don't have to implement this wavefunction anymore, because somebody has already done it for you. The function can be found in a notebook on Nestor. Your task is to make a plot using imshow, with the following properties: Make a 2D heat map, with a resolution of at least 1000x1000 pixels. (To do this, you have to increase the size of your linspaces.) Change the color scheme of the heat map to something different. In order to view the less probable areas, you may have to clip the maximum value of the probability density function. This will increase the contrast in the low-probability areas of the heat map. (Numpy has a clip function. How is it used?) Play around with the clipping values until you find something that works. The wavefunction of the single electron in neutral hydrogen is given by the formula: Unim(p, 0,6)=k.e-5p 22-1-1 (p)Y" (0,0) (6) Where quantum numbers n, l and m describing the wavefunction completely can take values le f0.1,..., n-1), and m e -1,-1+1,...,1-1,2). k is some normalization factor. Luckily, you don't have to implement this wavefunction anymore, because somebody has already done it for you. The function can be found in a notebook on Nestor. Your task is to make a plot using imshow, with the following properties: Make a 2D heat map, with a resolution of at least 1000x1000 pixels. (To do this, you have to increase the size of your linspaces.) Change the color scheme of the heat map to something different. In order to view the less probable areas, you may have to clip the maximum value of the probability density function. This will increase the contrast in the low-probability areas of the heat map. (Numpy has a clip function. How is it used?) Play around with the clipping values until you find something that works

Step by Step Solution

There are 3 Steps involved in it

Step: 1

blur-text-image

Get Instant Access to Expert-Tailored Solutions

See step-by-step solutions with expert insights and AI powered tools for academic success

Step: 2

blur-text-image

Step: 3

blur-text-image

Ace Your Homework with AI

Get the answers you need in no time with our AI-driven, step-by-step assistance

Get Started

Recommended Textbook for

Oracle Database 10g Insider Solutions

Authors: Arun R. Kumar, John Kanagaraj, Richard Stroupe

1st Edition

0672327910, 978-0672327919

More Books

Students also viewed these Databases questions