Answered step by step
Verified Expert Solution
Link Copied!

Question

1 Approved Answer

Python Mini Visualization Assignment Please use python to solve the following question (You don't need to upload your plot, you only need to upload your

Python Mini Visualization Assignment

Please use python to solve the following question (You don't need to upload your plot, you only need to upload your code :-)

p.s: if your code have many bugs, you will not receive a thumbs up!

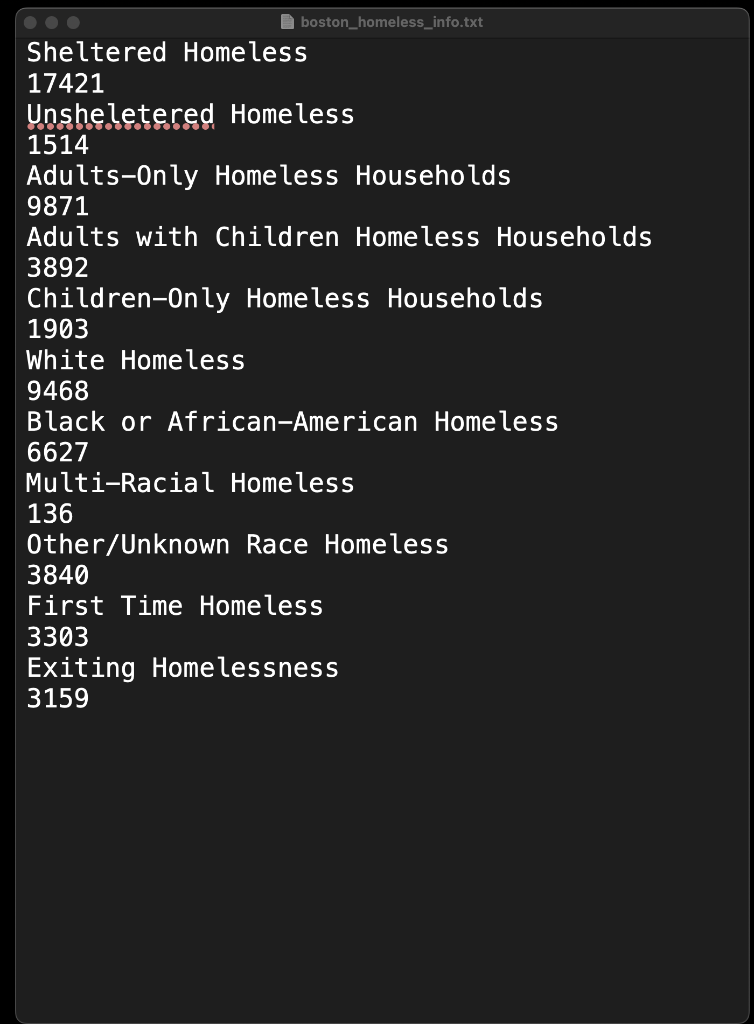
Name of the data set: "boston_homeless_info.txt"

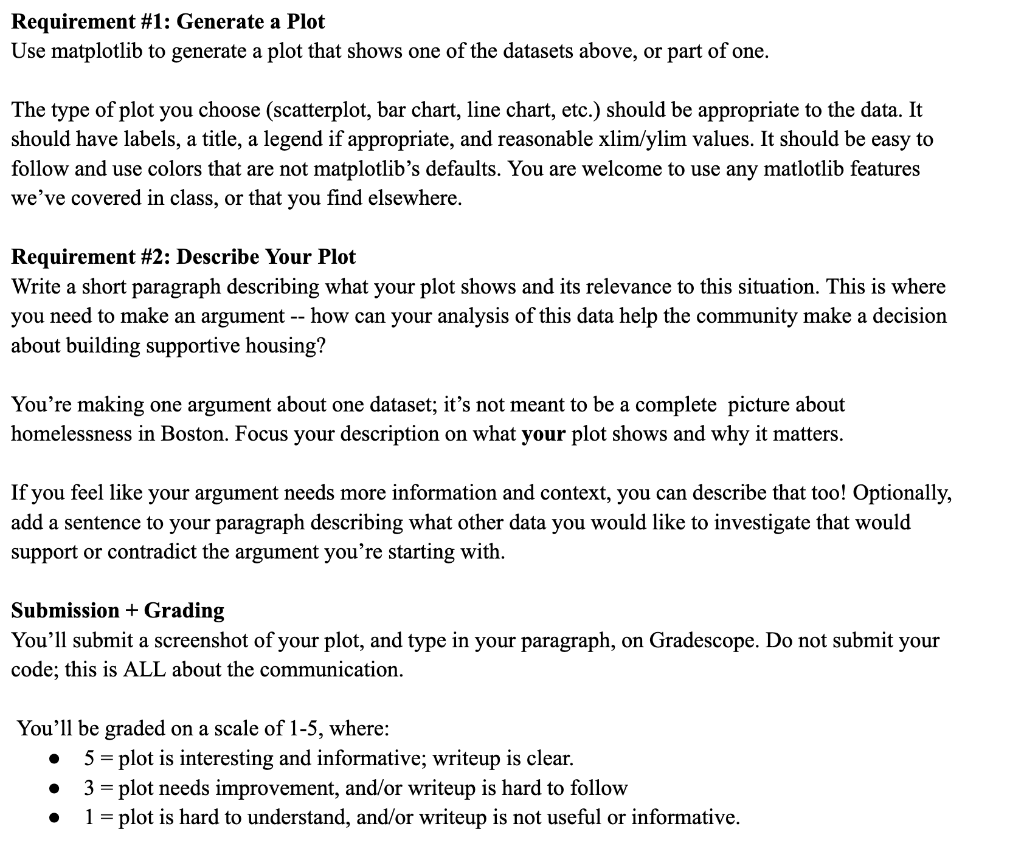
Requirement #1 Generate a Plot

Use matplotlib to generate a plot that shows one of the datasets above, or part of one. The type of plot you choose (scatterplot, bar chart, line chart, etc.) should be appropriate to the data. It should have labels, a title, a legend if appropriate, and reasonable xlim/ylim values. It should be easy to follow and use colors that are not matplotlibs defaults. You are welcome to use any matlotlib. You DONT neet to upload the picture of your plot! But the python code should be corret

Requirement #2: Describe Your Plot

Write a short paragraph describing what your plot shows and its relevance to this situation. This is where you need to make an argument -- how can your analysis of this data help the community make a decision about building supportive housing? Youre making one argument about one dataset; its not meant to be a complete picture about homelessness in Boston. Focus your description on what your plot shows and why it matters.

***Reference of the data set (.txt) file:

image text in transcribed

***Rubrics:

image text in transcribed

Sheltered Homeless 17421 Unsheletered Homeless 1514 Adults-Only Homeless Households 9871 Adults with Children Homeless Households 3892 Children-Only Homeless Households 1903 White Homeless 9468 Black or African-American Homeless 6627 Multi-Racial Homeless 136 0 ther/Unknown Race Homeless 3840 First Time Homeless 3303 Exiting Homelessness 3159 Use matplotlib to generate a plot that shows one of the datasets above, or part of one. The type of plot you choose (scatterplot, bar chart, line chart, etc.) should be appropriate to the data. It should have labels, a title, a legend if appropriate, and reasonable xlim/ylim values. It should be easy to follow and use colors that are not matplotlib's defaults. You are welcome to use any matlotlib features we've covered in class, or that you find elsewhere. Requirement \#2: Describe Your Plot Write a short paragraph describing what your plot shows and its relevance to this situation. This is where you need to make an argument -- how can your analysis of this data help the community make a decision about building supportive housing? You're making one argument about one dataset; it's not meant to be a complete picture about homelessness in Boston. Focus your description on what your plot shows and why it matters. If you feel like your argument needs more information and context, you can describe that too! Optionally, add a sentence to your paragraph describing what other data you would like to investigate that would support or contradict the argument you're starting with. Submission + Grading You'll submit a screenshot of your plot, and type in your paragraph, on Gradescope. Do not submit your code; this is ALL about the communication. You'll be graded on a scale of 15, where: - 5= plot is interesting and informative; writeup is clear. - 3= plot needs improvement, and/or writeup is hard to follow - 1= plot is hard to understand, and/or writeup is not useful or informative

Step by Step Solution

There are 3 Steps involved in it

Step: 1

blur-text-image

Get Instant Access to Expert-Tailored Solutions

See step-by-step solutions with expert insights and AI powered tools for academic success

Step: 2

blur-text-image

Step: 3

blur-text-image

Ace Your Homework with AI

Get the answers you need in no time with our AI-driven, step-by-step assistance

Get Started

Recommended Textbook for

Oracle Databases On The Web Learn To Create Web Pages That Interface With Database Engines

Authors: Robert Papaj, Donald Burleson

11th Edition

1576100995, 978-1576100998

More Books

Students also viewed these Databases questions