

Question
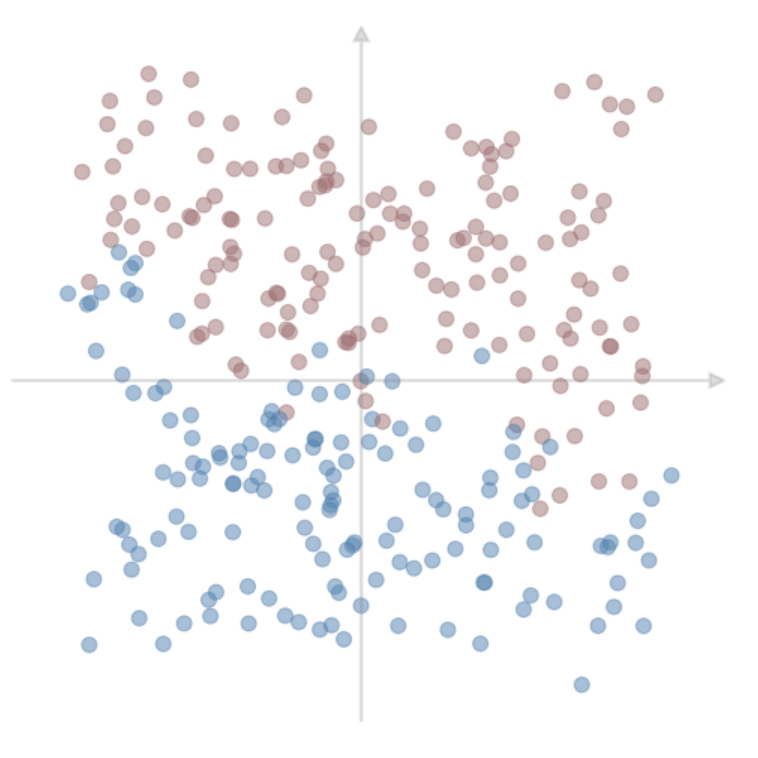
[PYTHON] Nonlinear SVM QUESTION: X, y = part3data(N=300, seed=1235) nonlinear_plot(X, y ) We can use the method SVC from sklearn's svm module to fit an
[PYTHON] Nonlinear SVM
QUESTION:
X, y = part3data(N=300, seed=1235) nonlinear_plot(X, y)
We can use the method SVC from sklearn's svm module to fit an SVM with a nonlinear kernel to the data. Go now and look at the documentation. Note that we pass the kernel="rbr" parameter to use the RBF kernel. The other two parameters we'll be concerned with are C and the RBF parameter gamma.
TO DO: Write some code to fit an SVM with RBF kernel to the data and plot the results. Use the parameter values C=1 and gamma=1. Do not change the code, just complete it:
from sklearn.svm import SVC
nlsvm= None # compete your code here
nonlinear_plot(X, y, nlsvm)
HERE'S the data to be used:
def part3data(N=100, seed=1235): np.random.seed(seed) X = np.random.uniform(-1,1,(N,2)) y = np.array([1 if y-x > 0 else -1 for (x,y) in zip(X[:,0]**2 * np.sin(2*np.pi*X[:,0]), X[:,1])]) X = X + np.random.normal(0,.1,(N,2)) return X, y
def nonlinear_plot(X, y, clf=None): mycolors = {"blue": "steelblue", "red": "#a76c6e", "green": "#6a9373"} fig, ax = plt.subplots(nrows=1, ncols=1, figsize=(10,10)) colors = [mycolors["red"] if yi==1 else mycolors["blue"] for yi in y] ax.scatter(X[:,0],X[:,1], marker='o', color=colors, s=100, alpha=0.5) ax.arrow(-1.25,0,2.5,0, head_length=0.05, head_width=0.05, fc="gray", ec="gray", lw=2, alpha=0.25) ax.arrow(0,-1.25,0,2.5, head_length=0.05, head_width=0.05, fc="gray", ec="gray", lw=2, alpha=0.25) z = np.linspace(0.25,3.5,10) ax.set_xlim([-1.50,1.50]) ax.set_ylim([-1.50,1.50]) ax.spines['top'].set_visible(False) ax.spines['right'].set_visible(False) ax.spines['bottom'].set_visible(False) ax.spines['left'].set_visible(False) plt.xticks([], fontsize=16) plt.yticks([], fontsize=16)
if clf: clf.fit(X,y)
x_min = X[:, 0].min()+.00 x_max = X[:, 0].max()-.00 y_min = X[:, 1].min()+.00 y_max = X[:, 1].max()-.00
colors = [mycolors["red"] if yi==1 else mycolors["blue"] for yi in y]
XX, YY = np.mgrid[x_min:x_max:200j, y_min:y_max:200j] Z = clf.decision_function(np.c_[XX.ravel(), YY.ravel()])
# Put the result into a color plot Z = Z.reshape(XX.shape) plt.contour(XX, YY, Z, colors=[mycolors["blue"], "gray", mycolors["red"]], linestyles=['--', '-', '--'], levels=[-1.0, 0, 1.0], linewidths=[2,2,2], alpha=0.9)
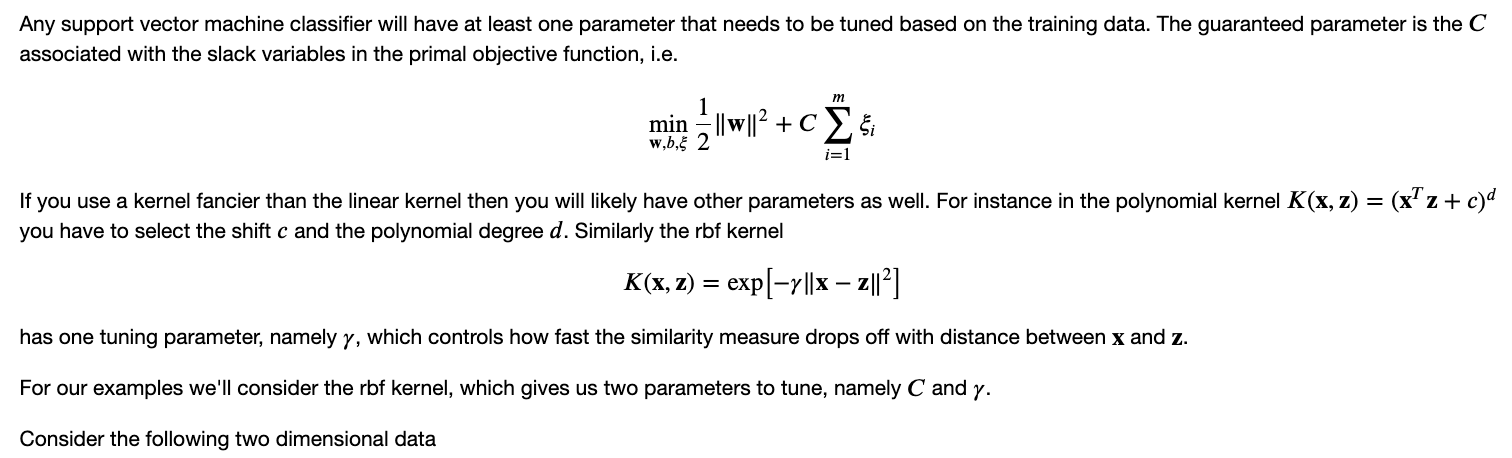
Any support vector machine classifier will have at least one parameter that needs to be tuned based on the training data. The guaranteed parameter is the C associated with the slack variables in the primal objective function, i.e. minw,b,21w2+Ci=1mi If you use a kernel fancier than the linear kernel then you will likely have other parameters as well. For instance in the polynomial kernel K(x,z)=(xTz+c)d you have to select the shift c and the polynomial degree d. Similarly the rbf kernel K(x,z)=exp[xz2] has one tuning parameter, namely , which controls how fast the similarity measure drops off with distance between x and z. For our examples we'll consider the rbf kernel, which gives us two parameters to tune, namely C and . Consider the following two dimensional data
Step by Step Solution
There are 3 Steps involved in it
Step: 1

Get Instant Access to Expert-Tailored Solutions
See step-by-step solutions with expert insights and AI powered tools for academic success
Step: 2

Step: 3
Ace Your Homework with AI
Get the answers you need in no time with our AI-driven, step-by-step assistance
Get Started
Oracle Database Foundations Technology Fundamentals For IT Success
Authors: Bob Bryla
1st Edition
0782143725, 9780782143720