Question
Python NumPy This lab a NumPy lab, and NumPy must be used to implement the solution (labs that do not utilize NumPy arrays and Mathematical
Python NumPy
This lab a NumPy lab, and NumPy must be used to implement the solution (labs that do not utilize NumPy arrays and Mathematical functions will not receive any credit).
Input data set: stock_px.csv
The data set contains price information for four stocks. One of the fist steps of any data analysis process is to study the input data set closely. In order to write effective code, the analyst must understand the following:
The structure of the data set (how is the data organized)
What information is contained in the data set... and what information is not (i.e., limitations of the available data)
What potential problems may occur while a computer program is parsing and processing the data. Is the data "clean"? Meaning that it contains no problematic data points -- are all data points recorded in a consistent format? Are there gaps/missing data points?
Assignment goal: The goal of this lab is to analyze the performance of four stocks over an 8-year period (roughly, 2003-2011). The stocks are: Apple, Microsoft, Exxon, and SPX (a company that specializes in infrastructure equipment, with a primary focus on AC and HVAC equipment).
Utilize NumPy to compute/obtain and report the following information about each stock's performance:
Minimum price for each year (2003's, 2004's, etc.)
Maximum price for each year ((2003's, 2004's, etc.)
Overall minimum and overall maximum price
Mean price (each year's, and also overall)
Median price (each year's and also overall)
Variance in price for each year (2003's, 2004's, etc.)
Overall variance for the entire time period (2003-2011)
Your own stock quality metric which we will refer to as "your lastname Score" (e.g., "Smith Score", "Adams Score"). Since this is your own metric, it is up to you to develop it based on your own judgement. You may utilize any combination of the above statistics and create a formula as complex (or as simple) as you'd like. You may also utilize stats that are not listed above. For example, if you'd rather look at the standard deviation than variance, that's fine. In your report, write a few sentences explaining and justifying your choices -- why is "your lastname Score" is the ultimate measure of stock quality?
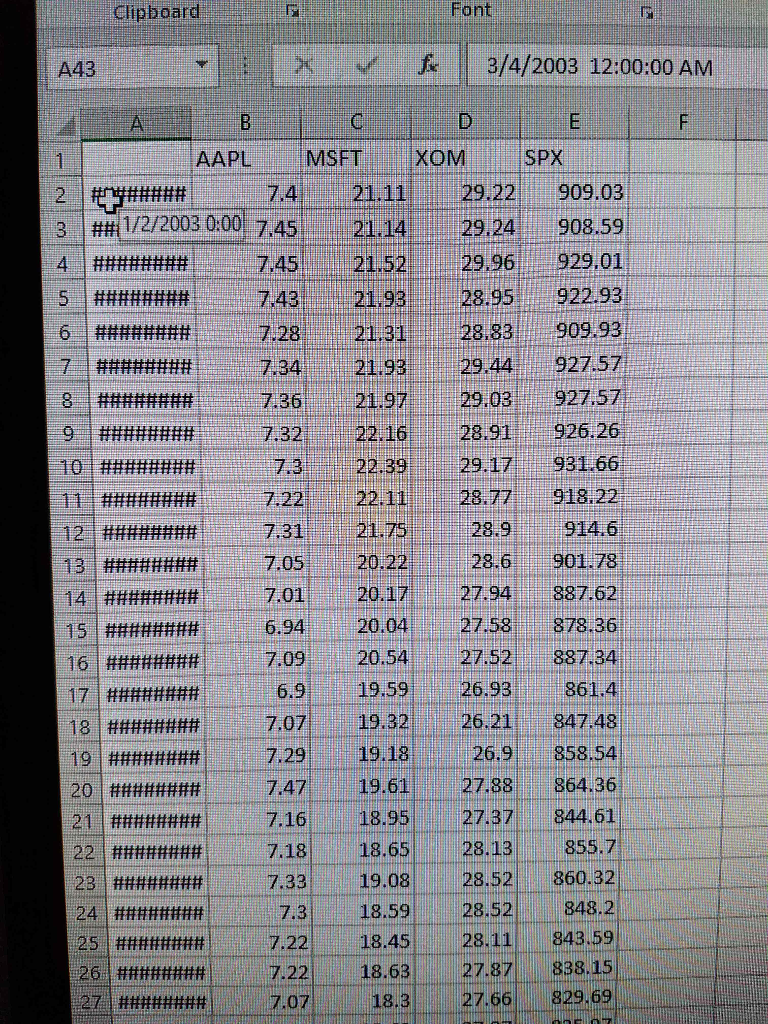
Here is the picture of excel file:

Here is part of data as text file dates go from 2003 to 2011:
AAPL MSFT XOM SPX 1/2/2003 0:00 7.4 21.11 29.22 909.03 1/3/2003 0:00 7.45 21.14 29.24 908.59 1/6/2003 0:00 7.45 21.52 29.96 929.01 1/7/2003 0:00 7.43 21.93 28.95 922.93 1/8/2003 0:00 7.28 21.31 28.83 909.93 1/9/2003 0:00 7.34 21.93 29.44 927.57 1/10/2003 0:00 7.36 21.97 29.03 927.57 1/13/2003 0:00 7.32 22.16 28.91 926.26 1/14/2003 0:00 7.3 22.39 29.17 931.66 1/15/2003 0:00 7.22 22.11 28.77 918.22 1/16/2003 0:00 7.31 21.75 28.9 914.6 1/17/2003 0:00 7.05 20.22 28.6 901.78 1/21/2003 0:00 7.01 20.17 27.94 887.62 1/22/2003 0:00 6.94 20.04 27.58 878.36 1/23/2003 0:00 7.09 20.54 27.52 887.34 1/24/2003 0:00 6.9 19.59 26.93 861.4 1/27/2003 0:00 7.07 19.32 26.21 847.48 1/28/2003 0:00 7.29 19.18 26.9 858.54 1/29/2003 0:00 7.47 19.61 27.88 864.36
clipboard Font 3/4/2003 12:00:00 AM AAPL 2 7.4 21.11 29.22 909.03 3 1/2/2003 0:00 7.45 21.14 29,24 908.59 29,96 929,01 7.45 5 1743 21,93 28 95 922.93 9.44 927.57 #######He 7.32 22.16 28.91 926.26 7.3 22.39 29.17 931.66 28.9 914.6 7.05 20.22 28.6 901 78 887.62 7.01 878 36 15 694 20.04 27.58 7.09 20,54 27.52 887.34 26 93 86 1.4 59 69 7.07 19.32 i 26.21 847.48 26,9 8.54 19.18 7,29 864.36 7.47 19.61 18.95 20 ttff###### 27.37 844.61 18.65 28.13 855.7 19.08 28.52 860.32 28.52 848 18,59 7.3 8.45 28.11 843.59 7.22 7.22 38, i 27.87 18.63 27.66 29.69 18.3
Step by Step Solution
There are 3 Steps involved in it
Step: 1

Get Instant Access to Expert-Tailored Solutions
See step-by-step solutions with expert insights and AI powered tools for academic success
Step: 2

Step: 3

Ace Your Homework with AI
Get the answers you need in no time with our AI-driven, step-by-step assistance
Get Started


