Question
PYTHON OR EXCEL Continuing with your design of a stand-alone system for a residence 5 miles off-grid, in a clearing in the woods, in the
PYTHON OR EXCEL
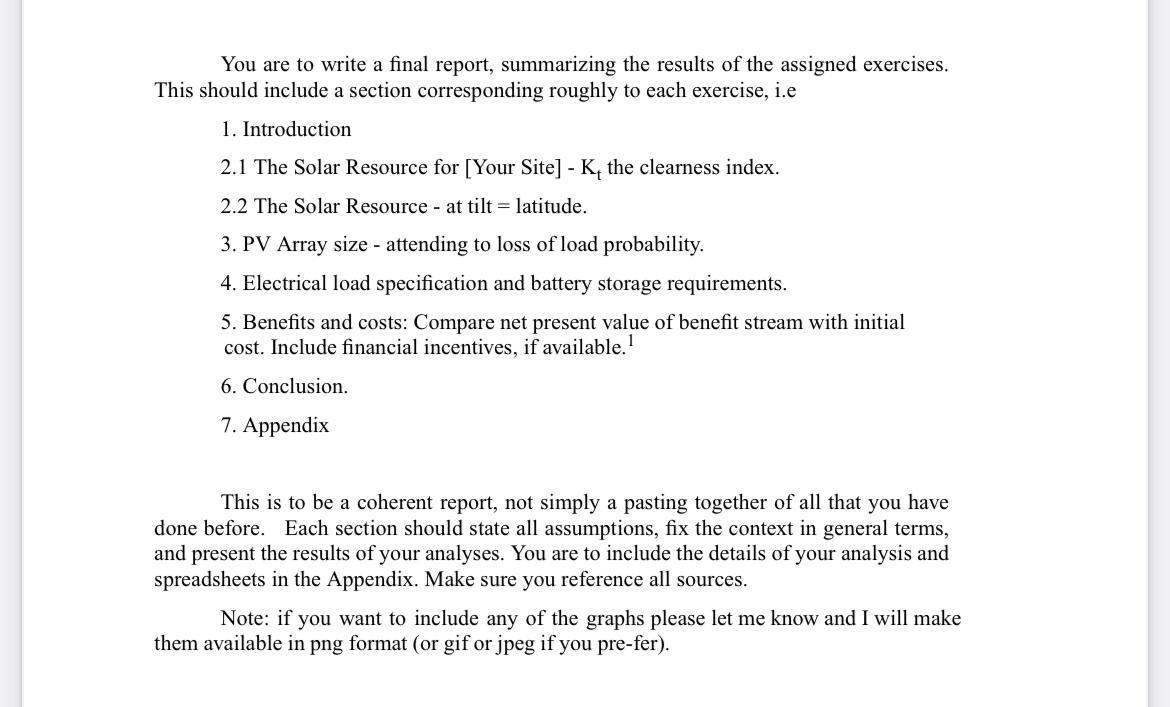
Continuing with your design of a stand-alone system for a residence 5 miles off-grid, in a clearing in the woods, in the vicinity of your city.Choose any place on 18'th latitude Do an inventory of all the electricall powered artifacts in vour residence. Conjecture a daily load profile for two seasons of the year - worst month and best month for solar flux rat vour nixed arrav tilt) your pv array and battery storage such that you have but a 1% chance of depleting the bat- terv. Note: take the probabilities for a good dav and a bad dav as those vou obtained assuming a horizontal attay and given your specitied load but now size the array using the flux at whatever tilt you choose - keep. ing the difference of the mean array output at tilt and the load the same. Cost out your system, using the web as a resource. Determine if there are any federal or state incentives for installing photovoltaics. If available, how do these change your cost estimates?

Step by Step Solution
There are 3 Steps involved in it
Step: 1

Get Instant Access to Expert-Tailored Solutions
See step-by-step solutions with expert insights and AI powered tools for academic success
Step: 2

Step: 3

Ace Your Homework with AI
Get the answers you need in no time with our AI-driven, step-by-step assistance
Get Started


