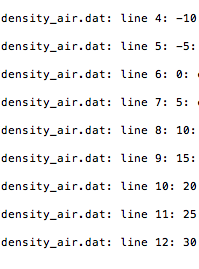
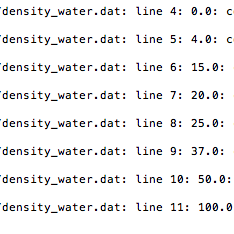
Python Please! data attached below


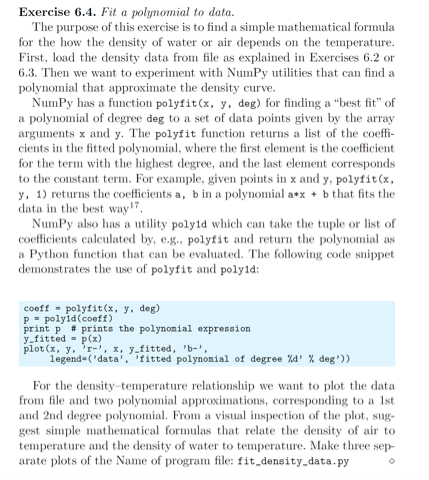
Exercise 6.4. Fit a polynomial to data. The purpose of this exercise is to find a simple mathematical formula for the how the density of water or air depends on the temperature. First, load the density data from file as explained in Exercises 6.2 or 6.3. Then we want to experiment with Numpy utilities that can find a polynomial that approximate the density curve. Numpy has a function polyfit(x, y, deg) for finding a best fit" of a polynomial of degree deg to a set of data points given by the array arguments x and y. The polyfit function returns a list of the coeffi- cients in the fitted polynomial, where the first element is the coefficient for the term with the highest degree, and the last element corresponds to the constant term. For example, given points in x and y, polyfit(x, y, 1) returns the coefficients a, b in a polynomial a*x + b that fits the data in the best way". Numpy also has a utility polyid which can take the tuple or list of coefficients calculated by, e.g., polyfit and return the polynomial as a Python function that can be evaluated. The following code snippet demonstrates the use of polyfit and polyid: coeff - polyfit(x, y, deg) p-polyid (coeff) print p prints the polynomial expression y fitted - p(x) plot(x, y, '-', x, y fitted, 'b-', legend( 'data', 'fitted polynomial of degree Xa' % deg')) For the density-temperature relationship we want to plot the data from file and two polynomial approximations, corresponding to a Ist and 2nd degree polynomial. From a visual inspection of the plot, sug- gest simple mathematical formulas that relate the density of air to temperature and the density of water to temperature. Make three sep- arate plots of the Name of program file: fit_density_data.py Exercise 6.4. Fit a polynomial to data. The purpose of this exercise is to find a simple mathematical formula for the how the density of water or air depends on the temperature. First, load the density data from file as explained in Exercises 6.2 or 6.3. Then we want to experiment with Numpy utilities that can find a polynomial that approximate the density curve. Numpy has a function polyfit(x, y, deg) for finding a best fit" of a polynomial of degree deg to a set of data points given by the array arguments x and y. The polyfit function returns a list of the coeffi- cients in the fitted polynomial, where the first element is the coefficient for the term with the highest degree, and the last element corresponds to the constant term. For example, given points in x and y, polyfit(x, y, 1) returns the coefficients a, b in a polynomial a*x + b that fits the data in the best way". Numpy also has a utility polyid which can take the tuple or list of coefficients calculated by, e.g., polyfit and return the polynomial as a Python function that can be evaluated. The following code snippet demonstrates the use of polyfit and polyid: coeff - polyfit(x, y, deg) p-polyid (coeff) print p prints the polynomial expression y fitted - p(x) plot(x, y, '-', x, y fitted, 'b-', legend( 'data', 'fitted polynomial of degree Xa' % deg')) For the density-temperature relationship we want to plot the data from file and two polynomial approximations, corresponding to a Ist and 2nd degree polynomial. From a visual inspection of the plot, sug- gest simple mathematical formulas that relate the density of air to temperature and the density of water to temperature. Make three sep- arate plots of the Name of program file: fit_density_data.py


