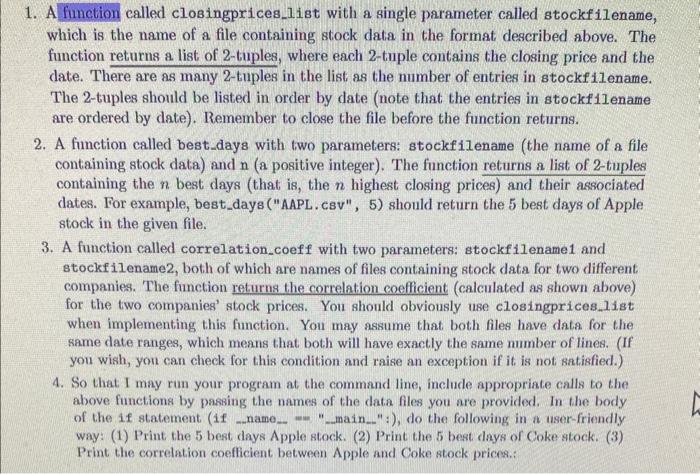
Problem 3 [24 points / Correlating Stock Data Correlation measures the relationahip between two variables in terms of strength and direction. Another way to state it is to say thint correlation messures the tendency of two variablea to increase or decrease at the same time. For example, sworage test neoms in s school are positively correlated with graduation rates (as one increages so does the other), whereas the Dow Joncs indutrial average and the price of gold are negativly correlated (an coe increves the otber derences). The measure of correlation is sometimes referred to as the correlation coefficient. 'Thrre are smeral algarithme for enlealating a correlation coefficient. Here, we condider the Pearson correlation coefficient, which is caleulated as shown below: r=(n1)SeSrn1(xi2)(w11) where 1,x2,,xn are n valow of the x variable, and y,98,,y= are a valuek of the y variable, 2 and y are the means of the two variahles, and Sz and S, ame the standurd deviations. Recell that the standard deviatich is defined a follonse S2=n1i1n(z1i)2 Note that the valine of r lien betwoen 1 and 1 . Wbre the valoe of r is clone to 1 , che two wariables are strongly ponitivily correlated; whin r is chee to-1, the two variabls ate strongly negalively correlateil; when r is close to 0 , the two variablos have no cocrilation. In thb problem, you ne neled to deteruine the cormintion betwern itock prion for two companin. This questbe is of interet because it could be a fictur in making ieventment A function called closingprices_iist with a single parameter called stockf ilename, which is the name of a file containing stock data in the format described above. The function returns a list of 2-tuples, where each 2-tuple contains the closing price and the date. There are as many 2-tuples in the list, as the number of entries in stockfilename. The 2-tuples should be listed in order by date (note that the entries in stockf1lename are ordered by date). Remember to close the file before the function returns. 2. A function called best_days with two parameters: stockfilename (the name of a file containing stock data) and n (a positive integer). The function returns a list of 2-tuples containing the n best days (that is, the n highest closing prices) and their associated dates. For example, best_days ("AAPL. csv", 5) should return the 5 best days of Apple stock in the given file. 3. A function called correlation_coeff with two parameters: stockfilename1 and stockfilename2, both of which are names of files containing stock data for two different. companies. The function returns the correlation coefficient (calculated as shown above) for the two companies' stock prices. You should obviously use closingprices_list when implementing this function. You may assume that both files have data for the same date ranges, which means that both will have exactly the same number of lines. (If you wish, you can check for this condition and raise an exception if it is not satisfied.) 4. So that I may run your program at the command line, include appropriate calls to the above functions by passing the names of the data files you are provided. In the body of the if statement (if _name _ -m "_main _.":), do the following in a user-friendly way: (1) Print the 5 best days Apple stock. (2) Print the 5 best days of Coke stock. (3) Print the correlation coeflicient between Apple and Coke stock prices.: Problem 3 (24 points ] Correlating Stock Data Currelatice avesuess the exlativolip be tuxen two variablos in terma of strength and direction. Anelber way to scate it is to ays that corrdation mesuleses the fendency of two variahles to incmase oe decnmee at the same price of gold are negutivly corselated (as obe increwes fler other decmanes). The mavure of cerrelation is nonnetiuns refened to as the cuerelation corflioint. There ate mveral alkorithun whikh is cakenlated as sbonu talue: r=(n1)SrSrn(xp1)(uks) y variable, it and y are the racaus of the two nariables, and 5 , aed 5 , ase the stambard deviations. Pecoll that the standard drviation is definel as follows: Ss=m11(xix)2 Note that the value of r lies betaves 1 and 1. Whre thr valio of r is does to 1 , the two variables are strongly poitively entrolated; wbre r ia ehoe to 1, the two varlahes ane strungly negatively correlated: wiece r is close to 0 , the two variables have bo condation. In this problem, you are anked to detrriaier the rotrelation betwenn abodk paken for two compatios. This qunstion bo of iaterot becatse it eould be a ferter ia mavine lavotarnt decinicais. If tuo stacks are poritively oonelated, and obe of them in incardeing, it may aucent that it is a good time to invest in the etlnt. You ase give stock data be o coeppasy in a CSV (cominn miparated vilue) file. Sour additinal draib abent the Ske ate ghime belver - Each line of the file luas 7 data valuos the dute, the ogemins steck peiper, the lugh price prics, and the rolueae (uumbers of slates teaded)- - The date is the date ee which the tribe eccurrod. Thiry aspeat it increabes chirceological order ian the file. - Note that the very first line of the file contains walue lealem and can le igeseed. - For this prodilem, we are intereded in only teo data naloss the dute (ille finst valier on endi line) and the eloning peice of the divy (the fifth raber in ench lise). You are prowided with stock data over a 5yrar period for Apple in the file ealled M.PL. cav abd for Cole is the the cakE. esv. (Histerical nteck date b millalle at tinasce. yaboo, coe ated and can be downhonded from there.) Use these files to test your code. fepetitine and uen an existing functian to carry eat at task whenever poovile. which is the make of a fille cothaining stock data in the Gimut dnerribed abon. The date. Thene are as nasy 2 -tuplos in the list ak the buulier of eitries in atocktilenase. The 2-tuphes should be listed is oeder hy date (ante that the astrin in stocktalenaee ate orderod ly date). Prauenber to ckne the file belore the funtice net untis 2. A function eallod best days with two paratineten: atockfilesane (the manse of a fike containing stock data) abd a (a poniluse lateser). The facthe starns a list of 2-tuples containing the a best dags (that in, the m bighest dowine prices) and their asmoiated dates. For example, beot dayo("H/AL, cev". 6) should netwan the 5 best dass of Apple stork in the kiven flele