Answered step by step
Verified Expert Solution
Link Copied!

Question

1 Approved Answer

Python problem Exercise 1: Plot the following function: F(K, L) = A KL(1-a) In order to plot this function set: A = 10, a =

Python problem image text in transcribed
Exercise 1: Plot the following function: F(K, L) = A KL(1-a) In order to plot this function set: A = 10, a = 0.33 and L = 20. Plot this function against values of KE [O, 10) Exercise 2: Plot the above function again into a new figure. Then change the total factor productivity A to 20 and plot the function again into the same graph. Repeat this for A = 21, A = 22, A = 23, and A = 24. Add a legend and labels for the axes as well as a title. You should have 6! functions plotted inside your figure. And you should now see how total factor productivity increases output

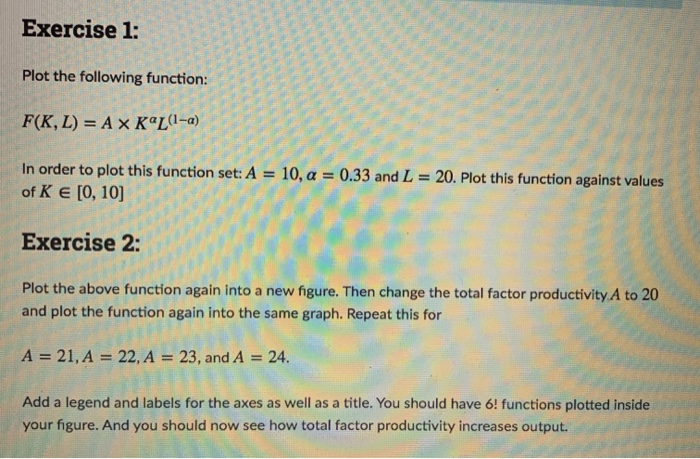
Step by Step Solution

There are 3 Steps involved in it

Step: 1

blur-text-image

Get Instant Access to Expert-Tailored Solutions

See step-by-step solutions with expert insights and AI powered tools for academic success

Step: 2

blur-text-image

Step: 3

blur-text-image

Ace Your Homework with AI

Get the answers you need in no time with our AI-driven, step-by-step assistance

Get Started

Recommended Textbook for

Inference Control In Statistical Databases From Theory To Practice Lncs 2316

Authors: Josep Domingo-Ferrer

2002nd Edition

3540436146, 978-3540436140

Students also viewed these Databases questions

Question

2. Identify the purpose of your speech

Answered: 1 week ago