Question
# Python problem. Problem 1: Faceted Histogram Run the following code block to define a function which generates two 1-dimensional numpy arrays. The first array,

# Python problem.
Problem 1: Faceted Histogram
Run the following code block to define a function which generates two 1-dimensional numpy arrays. The first array, called groups, consists of integers between 0 and n_groups - 1, inclusive. The second array, called data, consists of real numbers.
In [1]:
import numpy as np
from matplotlib import pyplot as plt
def create_data(n, n_groups):
"""
generate a set of fake data with group labels.
n data points and group labels are generated.
n_groups controls the number of distinct groups.
Returns an np.array() of integer group labels and an
np.array() of float data.
"""
# random group assignments as integers between 0 and n_groups-1, inclusive
groups = np.random.randint(0, n_groups, n)
# function of the groups plus gaussian noise (bell curve)
data = np.sin(groups) + np.random.randn(n)
return(groups, data)
Part A
Write a function called facet_hist(). This function should accept five arguments:
- groups, the np.array of group labels as output by create_data().
- data, the np.array of data as output by create_data().
- m_rows, the number of desired rows in your faceted histogram (explanation coming).
- m_cols, the number of desired columns in your faceted histogram (explanation coming).
- figsize, the size of the figure.
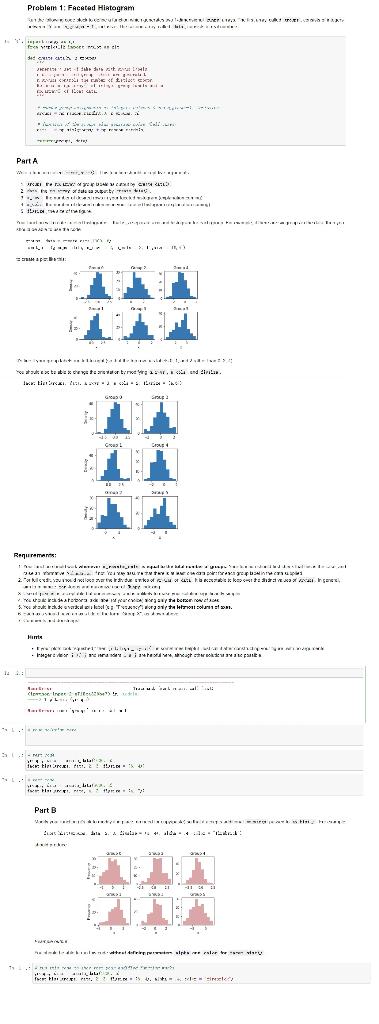
Your function will create faceted histograms -- that is, a separate axis and histogram for each group. For example, if there are six groups in the data, then you should be able to use the code
groups, data = create_data(1000, 6) facet_hist(groups, data, m_rows = 2, m_cols = 3, figsize = (6,4))
to create a plot like this:
It's fine if your group labels run left-to-right (so that the top row has labels 0, 1, and 2 rather than 0, 2, 4).
You should also be able to change the orientation by modifying m_rows, m_cols, and figsize.
facet_hist(groups, data, m_rows = 3, m_cols = 2, figsize = (4,6))
Requirements:
- Your function should work whenever m_rows*m_cols is equal to the total number of groups. Your function should first check that this is the case, and raise an informative ValueError if not. You may assume that there is at least one data point for each group label in the data supplied.
- For full credit, you should not loop over the individual entries of groups or data. It is acceptable to loop over the distinct values of groups. In general, aim to minimize for-loops and maximize use of Numpy indexing.
- Use of pandas is acceptable but unnecessary, and is unlikely to make your solution significantly simpler.
- You should include a horizontal axis label (of your choice) along only the bottom row of axes.
- You should include a vertical axis label (e.g. "Frequency") along only the leftmost column of axes.
- Each axis should have an axis title of the form "Group X", as shown above.
- Comments and docstrings!
Hints
- If your plots look "squished," then plt.tight_layout() is sometimes helpful. Just call it after constructing your figure, with no arguments.
- Integer division i // j and remainders i % j are helpful here, although other solutions are also possible.
Part B
Modify your function (it's ok to modify it in place, no need for copy/paste) so that it accepts additional **kwargs passed to ax.hist(). For example,
facet_hist(groups, data, 2, 3, figsize = (6, 4), alpha = .4, color = "firebrick")
should produce
Example output.
You should be able to run this code without defining parameters alpha and color for facet_hist().
In [ ]:
# run this code to show that your modified function works
groups, data = create_data(1000, 6)
facet_hist(groups, data, 2, 3, figsize = (6, 4), alpha = .4, color = "firebrick")Problem 1: Faceted Histogram 1 RANNARRI ARAHAT YELT. I SIEM ded: YOXS17 HEX 1.173 S .. ".: ---- ... E. Cell. Part A --- NEL WWW 2 year. is 5 1.4 ) e ....... aps ra PER ...... texta Excorterer:.* and 2 I. BI. 201... ... .. GO SOLE -32 Gros! Riqurements: TRETP. Eraserhea. yupo ... 01 TYVYYTETTYVIN 2 suwak * L x V x2 * xoc - TER X.RS RADOVA Strax evasul cakes: Text Twist. Hunts ...WYWIEN . Mevsimesed at RM Trauma creer .... 1.LT S.- REL 2.6 IKEREI S. 2! Du HAN." Part B 21 Leden 2. 4. lda.....: wa TEM #n P.PL trafris eraler tre . FHREAD. I sinek * Problem 1: Faceted Histogram 1 RANNARRI ARAHAT YELT. I SIEM ded: YOXS17 HEX 1.173 S .. ".: ---- ... E. Cell. Part A --- NEL WWW 2 year. is 5 1.4 ) e ....... aps ra PER ...... texta Excorterer:.* and 2 I. BI. 201... ... .. GO SOLE -32 Gros! Riqurements: TRETP. Eraserhea. yupo ... 01 TYVYYTETTYVIN 2 suwak * L x V x2 * xoc - TER X.RS RADOVA Strax evasul cakes: Text Twist. Hunts ...WYWIEN . Mevsimesed at RM Trauma creer .... 1.LT S.- REL 2.6 IKEREI S. 2! Du HAN." Part B 21 Leden 2. 4. lda.....: wa TEM #n P.PL trafris eraler tre . FHREAD. I sinek *
Step by Step Solution
There are 3 Steps involved in it
Step: 1

Get Instant Access to Expert-Tailored Solutions
See step-by-step solutions with expert insights and AI powered tools for academic success
Step: 2

Step: 3

Ace Your Homework with AI
Get the answers you need in no time with our AI-driven, step-by-step assistance
Get Started


