

Question
Python program for hurricanes using loop function * I wrote the program to the point where it brings up the image, but I have no
Python program for hurricanes using loop function
* I wrote the program to the point where it brings up the image, but I have no idea after :(
Description
In this assignment you will create a program that plots a hurricanes track through the Caribbean and surrounding areas. The user will enter latitude, longitude and wind speed data which your program will display on a map. Dots of different colors and sizes will be used to represent hurricanes of different strengths, and lines will be used to connect the dots to illustrate its path.
Completing this assignment will require the use of loops and if statements. You do not need to write your own Python functions to complete this assignment, though you may if you would like to. If you choose to write your own functions you must use them properly, including thorough documentation.
The following sections provide additional requirements and suggestions for implementing your program.
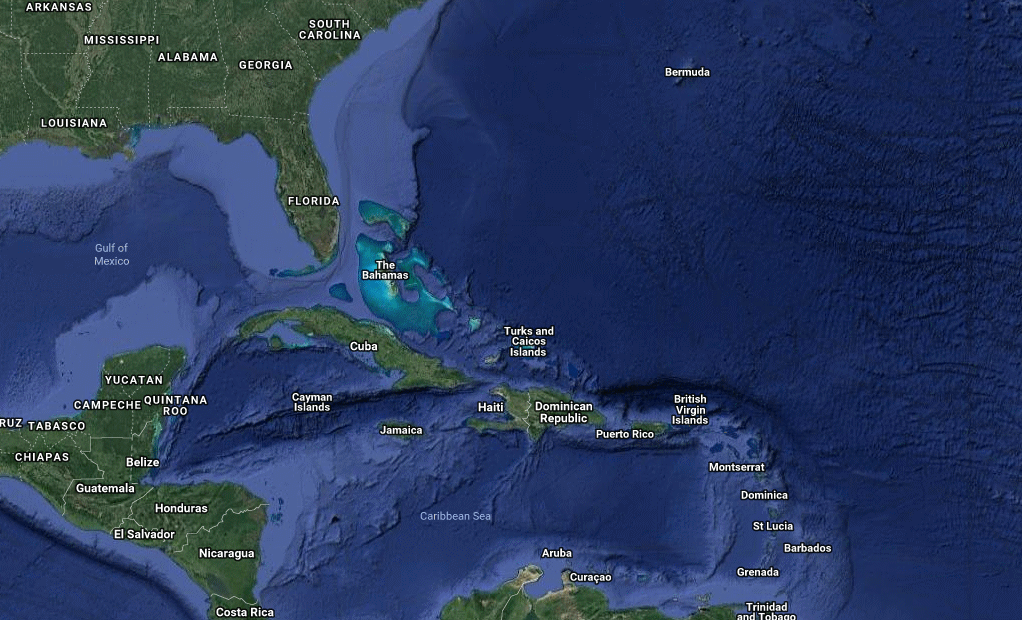
Part 1: Drawing the Map
A map of Caribbean can be found in map.gif on the course website. Your program should begin by resizing the graphics window so that it is the same size as the map (1022 pixels wide and 620 pixels high). Then the map should be displayed. This can be accomplished using the loadImage and drawImage functions. The loadImage function takes the name of the file to load (a string) as its only argument and returns an image as its result. This image can be drawn by passing it as the first argument to drawImage. The drawImage function also requires the x and y location where the image should be drawn as its second and third arguments.
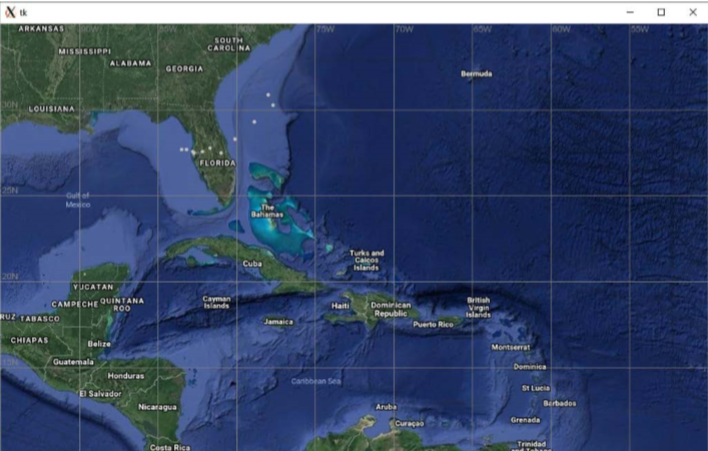
Once the map has been displayed your program should go on and add lines of latitude and longitude to it. These lines should both be 5 degrees apart and labelled with their latitude / longitude value (including the directional indicator). The left edge of the map is 95 degrees west while its right edge is at 50 degrees west. The bottom edge of the map is at 10 degrees north while its top edge is at 35 degrees north. For simplicity we will drawn the lines of longitude as vertical lines (rather than curves) and we will use equal spacing for all degrees of latitude rather than performing a complex projection. Use loops to draw these lines. It is not acceptable to use a (long) collection of line and text function calls to complete this task.
After completing this step your program should display the following image:
Part 2: Plotting the Hurricanes Location
Once the map is drawn your program will read data about the hurricanes location and wind speed from the user. The latitude will be entered first (as a floating-point number of degrees north of the equator), followed by the longitude (as a floating-point number of degrees east of the prime meridian), followed by the wind speed (as a floating-point number of miles per hour). Note that all of the longitude values entered will be negative because the Caribbean is west of the prime meridian.
Latitude, longitude and wind speed values will continue to be entered until the user enters a latitude of 0 degrees. Each time a latitude and longitude value are read your program should plot a small gray circle with a width and height of 5 pixels on the map at the indicated location. For example, plotting the data for Emily (technically a tropical storm, not a hurricane) should draw several dots across Florida, as shown below:
Hint: Every time you run your program you will need to enter several data values. You can automate this by using a feature known as I/O redirection, which will allow your program to read the values from a file instead of from the keyboard. For example, to use the values from the file named Emily.txt instead of reading values from the keyboard, enter the command:
python Asn2.py
The details of how I/O redirection works arent important within the scope of this course, but your ability to use it by following the pattern above will save you a significant amount of typing. Several sample data sets saved in the correct format are available on the course website. Feel free to get as much help as you need with I/O redirection from the TAs or instructor. I/O redirection can be used from the terminal / command prompt on Windows, MacOS and Linux.
Part 3: Adding Color and Size
Hurricanes are divided into 5 categories based on their wind speed. These are summarized in the following table:
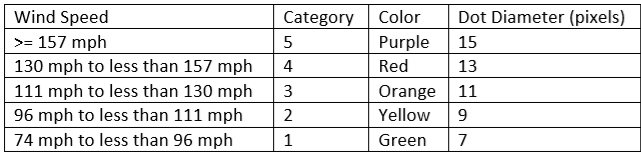
The hurricane data plotted on the map will be more meaningful if different colors and sizes are used for different storm categories. Use the data in the preceding table to color the dots according to the storms wind speed, and use the dot diameters from the table so that more server storms occupy more space on the map. Storms with a wind speed below 74 miles per hour are classified as tropical storms (wind speeds of 39 mph or more) or tropical depressions (wind speeds less than 38 mph). Such storms should continue to be drawn in gray using a circle that is 5 pixels in diameter.
The dots for Hurricane Irene is are shown below:
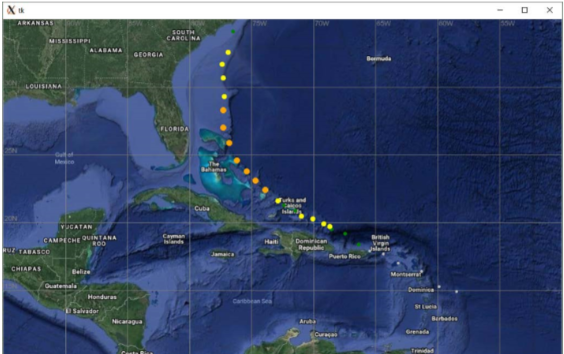
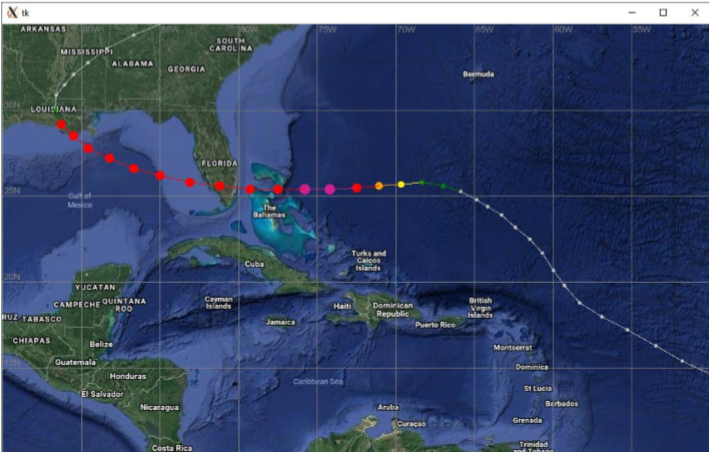
Part 4: Connecting the Dots
Your next task is to connect the dots that you drew previously so that the hurricanes track is a line instead of a collection of disconnected points. Two points are required to draw a line segment. As a result you will need the (x, y) location of the previous dot, as well as the (x, y) location of the current dot, in order to draw the line segment. The previous x and y values can be retained by storing them into appropriately named variables at the bottom of the loop. Then these variables can be read in the next loop iteration to draw the line segment, noting that such a line segment should not be drawn the first time the loop executes. The color of the line segment should match the color of the current dot.
The connected track for Hurricane Andrew is shown below:
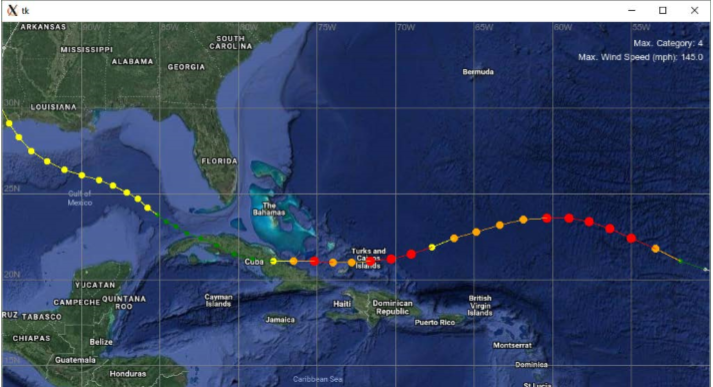
Part 5: Classifying the Storm
After all of the dots and lines have been drawn your program should report the storms maximum category and maximum wind speed in the upper right corner of the window. Report a maximum category of 0 for tropical storms and tropical depressions. This data is shown for Hurricane Ike below. Note that the window has been cropped so that it will fit on this page.
Additional Specifications:
Your program should follow good programming practices. This includes using meaningful variable names, avoiding the use of magic numbers and including adequate comments. Magic numbers you should specifically avoid using include:
The gap between the lines of latitude and longitude drawn on the map
The dimensions of the map image
The latitude / longitude values for the boundary of the map.
Ideally, if you wanted to use a different map then you should only need to change the image dimensions and boundary values in one place in your program and then every would continue to work correctly. You should also ensure that you include a comment at the top of the file with your name, student number and a brief description of the purpose of your program.
Break and continue are generally considered bad form. As a result, you are NOT allowed to use them when creating your solution to this assignment. In general, their use can be avoided by using a combination of if statements and writing better conditions on your while loops.
You do not need to perform any error checking in your program. In particular, you may assume that the user always enters valid floating-point numbers. Any latitude / longitude values that are outside of the window should be drawn just like values inside the window. SimpleGraphics will simply ignore any requests to draw outside of the window.
Your program should leave the window open until the user closes it by clicking on the close button.
Grading:
This assignment will be graded on a combination of functionality and style. A base grade will be determined from the general level of functionality of the program (Does it draw the map successfully? Are the lines of latitude and longitude drawn correctly? Does it plot the dots in the correct location? Are the correct colors used for storms in different categories? Is the hurricanes track connected properly?). The base grade will be recorded as a mark out of 12.
ARKANSAS SOUTH CAROLINA MISSISSIPPI ALABAMA GEORGIA Bermuda LOUISIANA FLORIDA Gulf of Mexico The Bahamas Turks and Caicos Islands Cuba YUCATAN Cayman Islands British Virgin Islands CAMPECHE QUINTANA Haiti Dominican Republic ROO RUZ TABASCO Jamaica Puerto Rico CHIAPAS Belize Montserrat Guatemala Dominica Honduras Caribbean Sea El Salvador Barbados Nicaragua Aruba Grenada Curaao Trinidad Costa Rica ARKANSAS SOUTH CAROLINA MISSISSIPPI ALABAMA GEORGIA Bermuda LOUISIANA FLORIDA Gulf of Mexico The Bahamas Turks and Caicos Islands Cuba YUCATAN Cayman Islands British Virgin Islands CAMPECHE QUINTANA Haiti Dominican Republic ROO RUZ TABASCO Jamaica Puerto Rico CHIAPAS Belize Montserrat Guatemala Dominica Honduras Caribbean Sea El Salvador Barbados Nicaragua Aruba Grenada Curaao Trinidad Costa RicaStep by Step Solution
There are 3 Steps involved in it
Step: 1

Get Instant Access to Expert-Tailored Solutions
See step-by-step solutions with expert insights and AI powered tools for academic success
Step: 2

Step: 3
Ace Your Homework with AI
Get the answers you need in no time with our AI-driven, step-by-step assistance
Get Started
Ai And Election 2024 How Widely Accessible A I Tools Will Shape And Fuel The Spread Of Disinformation Create Hazards To Democracy And Affect The Upcoming 2024 U S Presidential Election
Authors: Elise Dawson
1st Edition
B0CP9YH1YR, 979-8870441016