Python Program. Please complete Checkpoint B, final code, and extra credit if possible. Attached are the insctructions and the code I have for Checkpoint A. Feel free to edit the code that I have for Checkpoint A. Please make sure the program is written as simply to understand as possible (beginner level type code) and make sure it runs and gives the same outputs as the examples, thank you very much :)
i pasted everything i could
Checkpoint A code:
print('==> Windchill Temperature (WCT) Weather Report Calculator for i in range(locations): name=input('Enter name of ** Location %s **: ' % str(i+1)) air_temp=float(input('\t Enter air temperature [in def F]: ')) wind_vel=float(input('\t Enter wind velocity [in mph]: ')) wct=35.74 + 0.6215 * air_temp -35.75 * (wind_vel ** 0.16) + 0.4275 * air_temp*(wind_vel**0.16) print('\t WCT is %.*f def F.' %(precision,wct)) 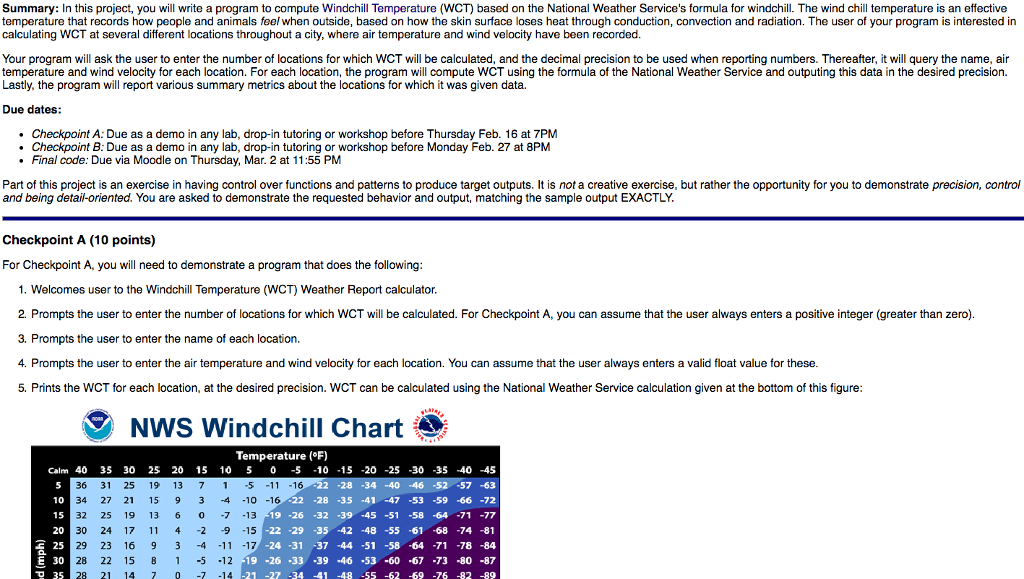
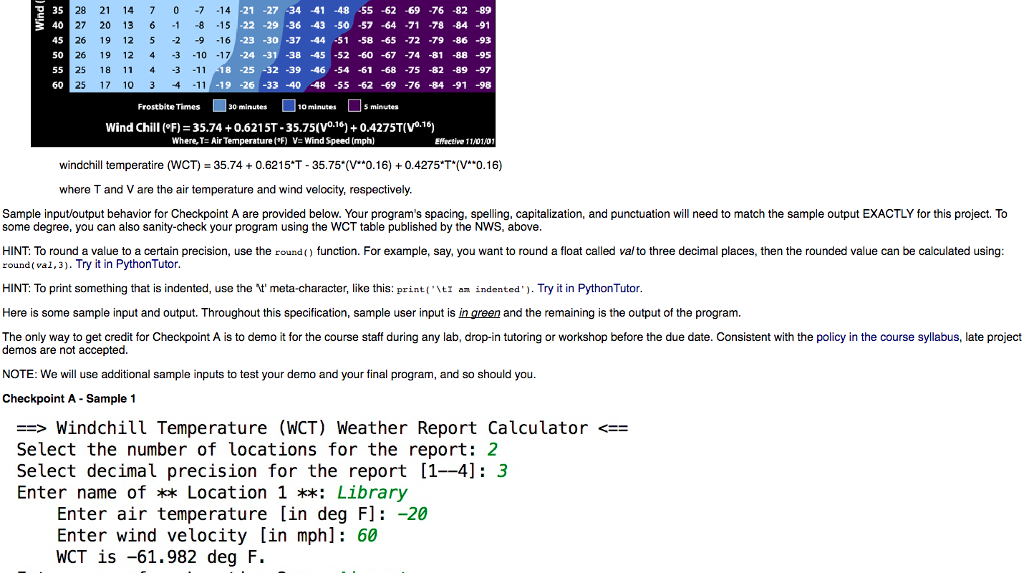
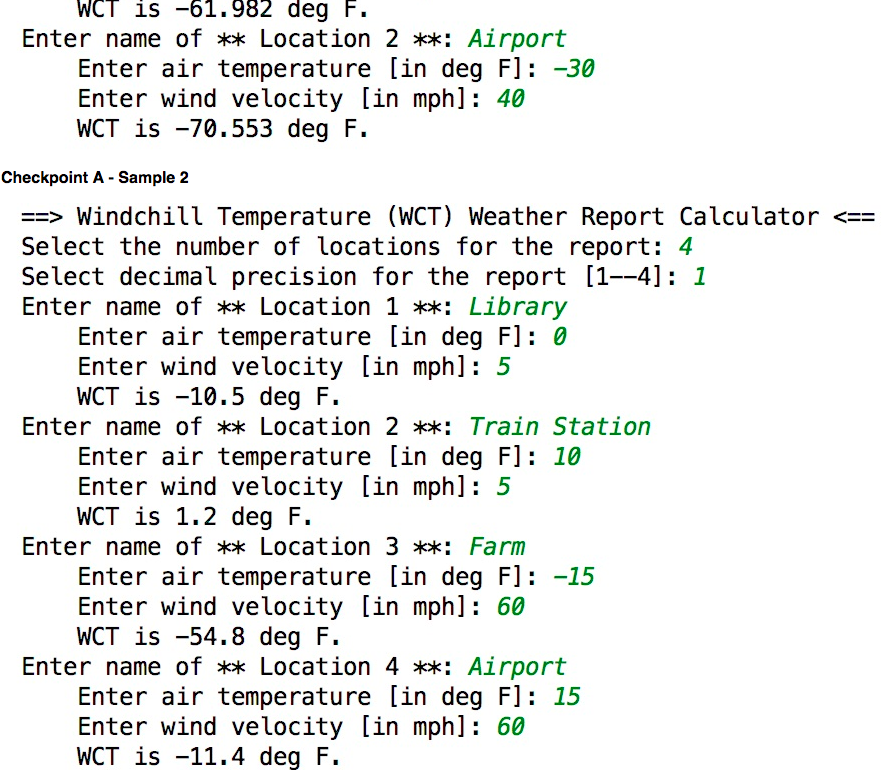
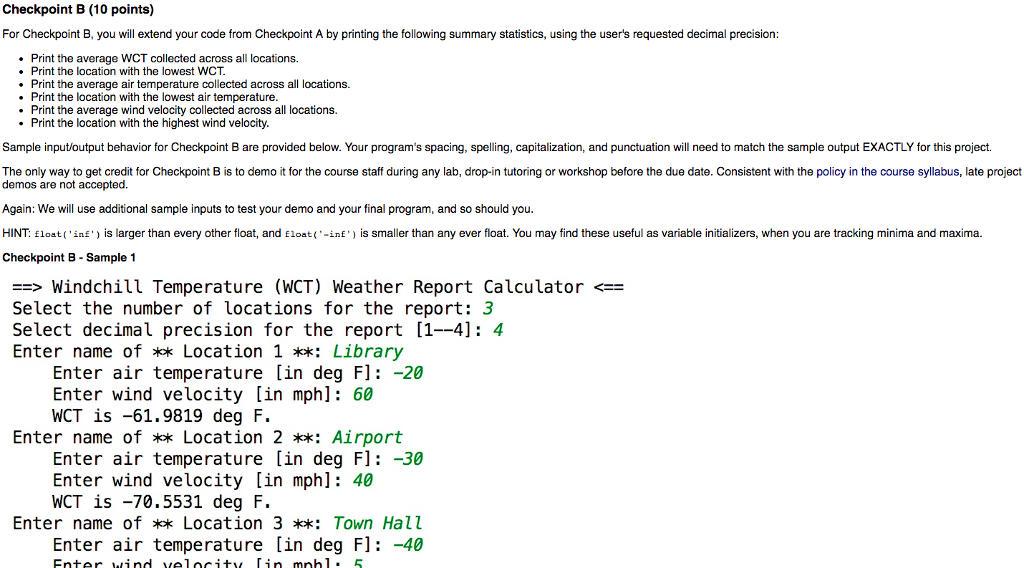
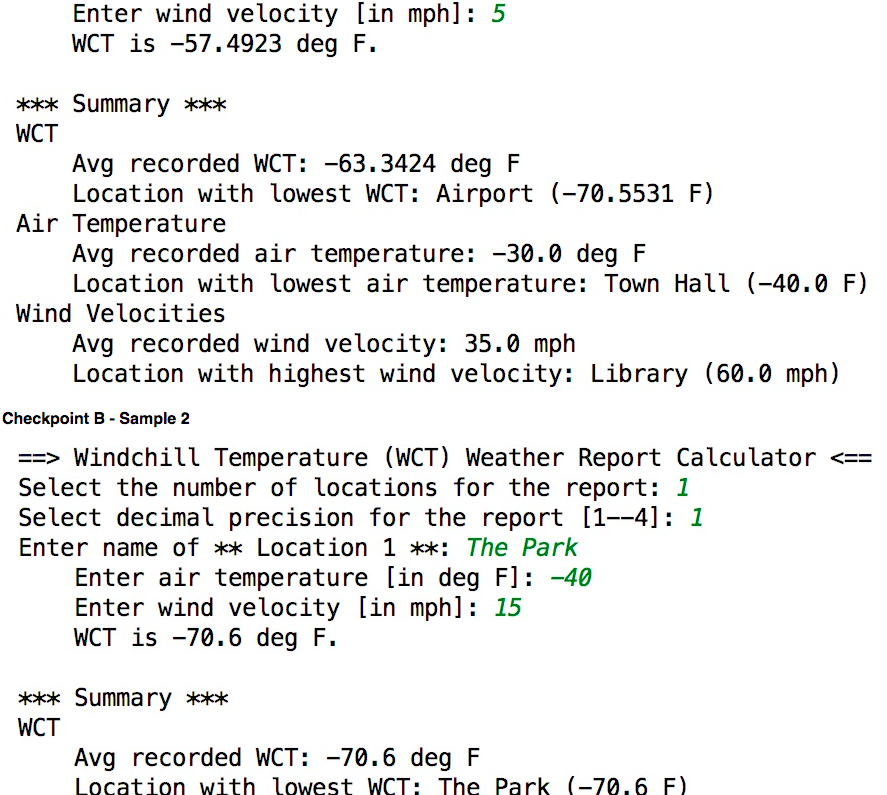
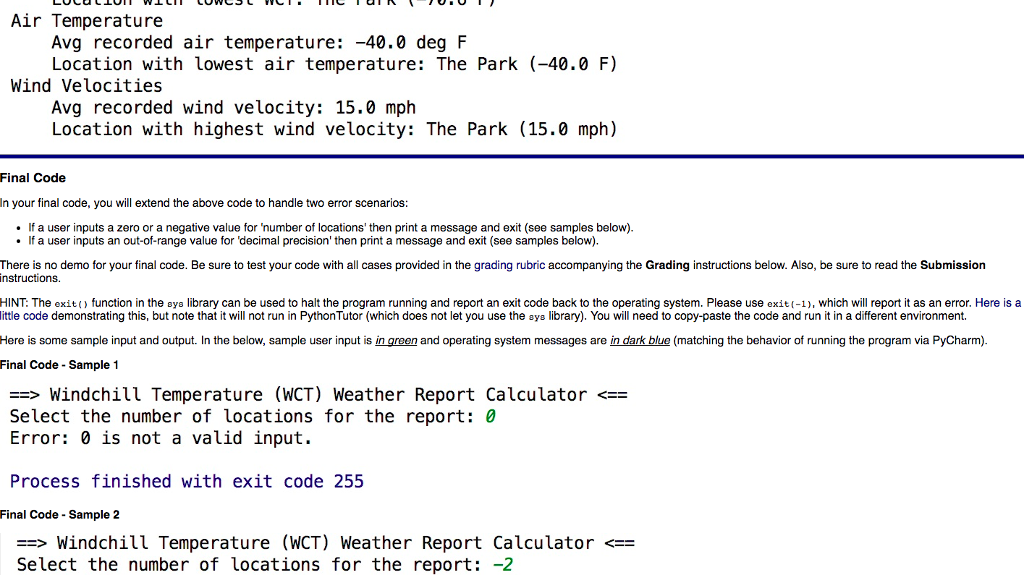
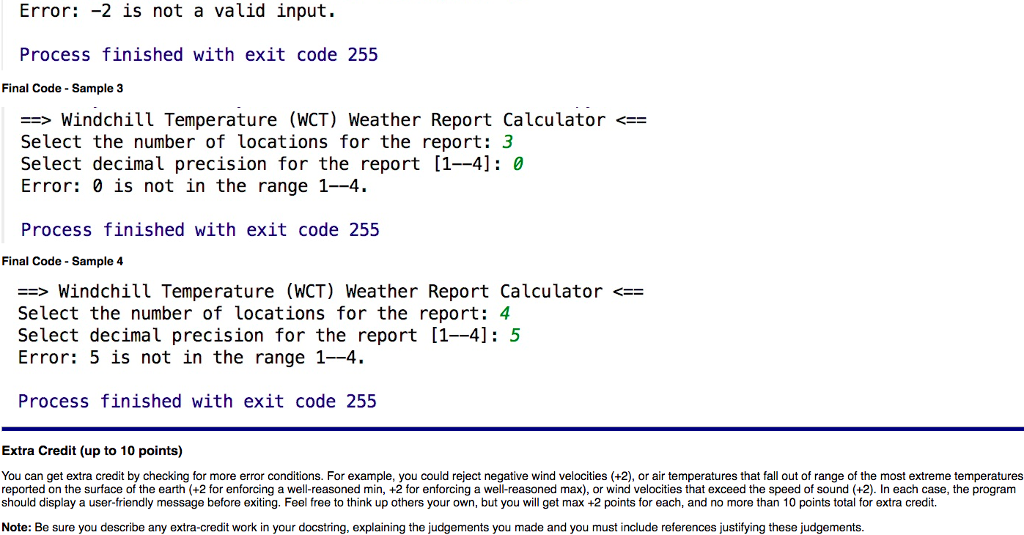
Summary: In this project, you will write a program to compute Windchill Temperature (WCT based on the National Weather Service's formula for windchill. The wind chill temperature is an effective temperature that records how people and animals feel when outside, based on how the skin surface loses heat through conduction, convection and radiation. The user of your program is interested in calculating WCT at several different locations throughout a city, where air temperature and wind velocity have been recorded Your program will ask the user to enter the number of locations for which WCT will be calculated, and the decimal precision to be used when reporting numbers. Thereafter, it will query the name, a temperature and wind velocity for each location. For each location, the program will compute WCT using the formula of the National Weather Service and outputing this data in the desired precision. Lastly, the program will report various summary metrics about the locations for which it was given data. Due dates: Checkpoint A: Due as a demo in any lab, drop-in tutoring or workshop before Thursday Feb. 16 at 7PM Checkpoint B. Due as a demo in any lab, drop-in tutoring or workshop before Monday Feb. 27 at 8PM Final code: Due via Moodle on Thursday, Mar. 2 at 11:55 PM Part of this project is an exercise in having control over functions and patterns to produce target outputs. It is not a creative exercise, but rather the opportunity for you to demonstrate precision, control and being detail-oriented. You are asked to demonstrate the requested behavior and output, matching the sample output EXACTLY Checkpoint A (10 points) For Checkpoint A, you will need to demonstrate a program that does the following 1. Welcomes user to the Windchill Temperature (WCT Weather Report calculator 2. Prompts the user to enter the number of locations for which WCT will be calculated. For Checkpoint A, you can assume that the user always enters a positive integer (greater than zero) 3. Prompts the user to enter the name of each location 4. mpts the user to enter the temperature value for these air and wind velocity for each location. You can assume tha the user always enters a valid float 5. Prints the WCT for each location, at the desired precision. WCT can be calculated using the National Weather Service calculation given at the bottom of this figure: Nws windchill chart Temperature F) Calm 40 35 30 25 20 15 10 10 -15 -20 -25 -30 -35 -40 -45 2 -28 -34 -40 -46 -52 -57 -63 36 10 28 35 -41 -47 -53 -59 -66 72 15 25 39 -45 -5 -58 -64 71 77 20 30 -22 -29 48 -55 -61 -68 74 -81 aE 25 29 23 37 -44 51 58 -64 71 78 -84 E 30 28 22 26 -33 -39 -46 -53 -60 -67 -73 -80 -87 TU 35 55 -62 -69 76 -82 -89 Summary: In this project, you will write a program to compute Windchill Temperature (WCT based on the National Weather Service's formula for windchill. The wind chill temperature is an effective temperature that records how people and animals feel when outside, based on how the skin surface loses heat through conduction, convection and radiation. The user of your program is interested in calculating WCT at several different locations throughout a city, where air temperature and wind velocity have been recorded Your program will ask the user to enter the number of locations for which WCT will be calculated, and the decimal precision to be used when reporting numbers. Thereafter, it will query the name, a temperature and wind velocity for each location. For each location, the program will compute WCT using the formula of the National Weather Service and outputing this data in the desired precision. Lastly, the program will report various summary metrics about the locations for which it was given data. Due dates: Checkpoint A: Due as a demo in any lab, drop-in tutoring or workshop before Thursday Feb. 16 at 7PM Checkpoint B. Due as a demo in any lab, drop-in tutoring or workshop before Monday Feb. 27 at 8PM Final code: Due via Moodle on Thursday, Mar. 2 at 11:55 PM Part of this project is an exercise in having control over functions and patterns to produce target outputs. It is not a creative exercise, but rather the opportunity for you to demonstrate precision, control and being detail-oriented. You are asked to demonstrate the requested behavior and output, matching the sample output EXACTLY Checkpoint A (10 points) For Checkpoint A, you will need to demonstrate a program that does the following 1. Welcomes user to the Windchill Temperature (WCT Weather Report calculator 2. Prompts the user to enter the number of locations for which WCT will be calculated. For Checkpoint A, you can assume that the user always enters a positive integer (greater than zero) 3. Prompts the user to enter the name of each location 4. mpts the user to enter the temperature value for these air and wind velocity for each location. You can assume tha the user always enters a valid float 5. Prints the WCT for each location, at the desired precision. WCT can be calculated using the National Weather Service calculation given at the bottom of this figure: Nws windchill chart Temperature F) Calm 40 35 30 25 20 15 10 10 -15 -20 -25 -30 -35 -40 -45 2 -28 -34 -40 -46 -52 -57 -63 36 10 28 35 -41 -47 -53 -59 -66 72 15 25 39 -45 -5 -58 -64 71 77 20 30 -22 -29 48 -55 -61 -68 74 -81 aE 25 29 23 37 -44 51 58 -64 71 78 -84 E 30 28 22 26 -33 -39 -46 -53 -60 -67 -73 -80 -87 TU 35 55 -62 -69 76 -82 -89


