Answered step by step
Verified Expert Solution
Question
1 Approved Answer
Python Q2. Read the following dataset: covid-data.csv and answer the following questions and do the tasks after import the necessary libraries. 1. Load the dataset

Python
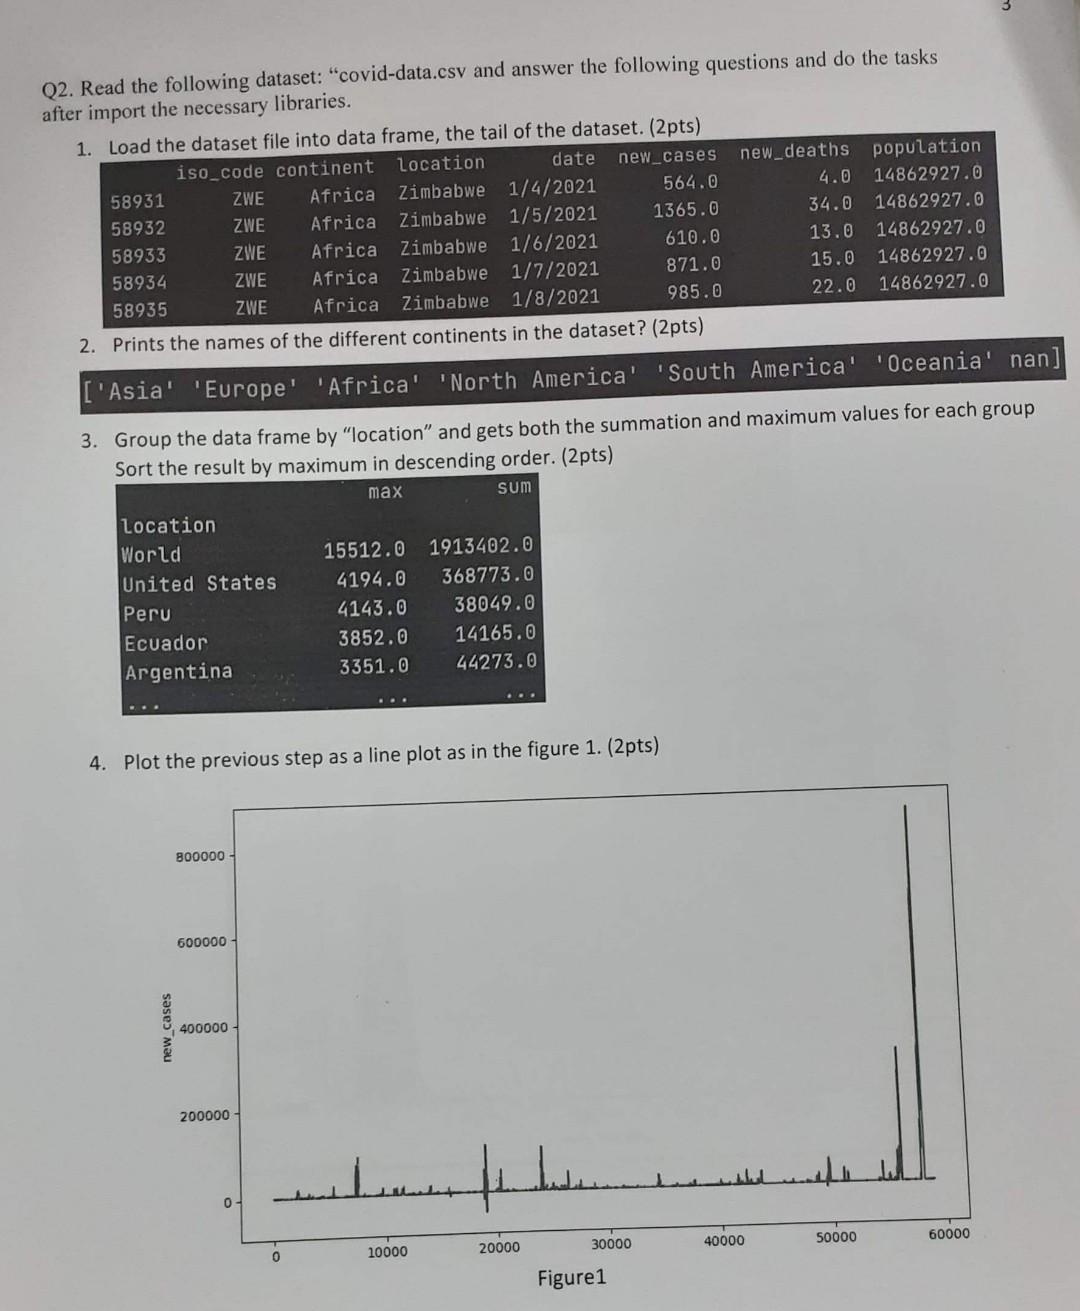
Q2. Read the following dataset: "covid-data.csv and answer the following questions and do the tasks after import the necessary libraries. 1. Load the dataset file into data frame, the tail of the dataset. (2pts) iso_code continent Location date new_cases new_deaths population 58931 ZWE Africa Zimbabwe 1/4/2021 564.0 4.0 14862927.0 58932 ZWE Africa Zimbabwe 1/5/2021 1365.0 34.0 14862927.0 58933 ZWE Africa Zimbabwe 1/6/2021 610.0 13.0 14862927.0 58934 ZWE Africa Zimbabwe 1/7/2021 871.0 15.0 14862927.0 58935 ZWE Africa Zimbabwe 1/8/2021 985.0 22.0 14862927.0 2. Prints the names of the different continents in the dataset? (2pts) Asia' 'Europe 'Africa' 'North America' 'South America' 'Oceania' nan] 3. Group the data frame by "location" and gets both the summation and maximum values for each group Sort the result by maximum in descending order. (2pts) max sum location World 15512.0 1913402.0 United States 4194.0 368773.0 Peru 4143.0 38049.0 Ecuador 3852.0 14165.0 Argentina 3351.0 44273.0 4. Plot the previous step as a line plot as in the figure 1. (2pts) 800000 600000 new cases 400000 200000 0 40000 50000 60000 10000 30000 0 20000 Figure1Step by Step Solution
There are 3 Steps involved in it
Step: 1

Get Instant Access to Expert-Tailored Solutions
See step-by-step solutions with expert insights and AI powered tools for academic success
Step: 2

Step: 3

Ace Your Homework with AI
Get the answers you need in no time with our AI-driven, step-by-step assistance
Get Started


