Question: Python: Titanic Data with pandas Q1-1 . use read_csv function to read in the data as df Q1-2 . Verify that you get 891 lines
Python: Titanic Data with pandas
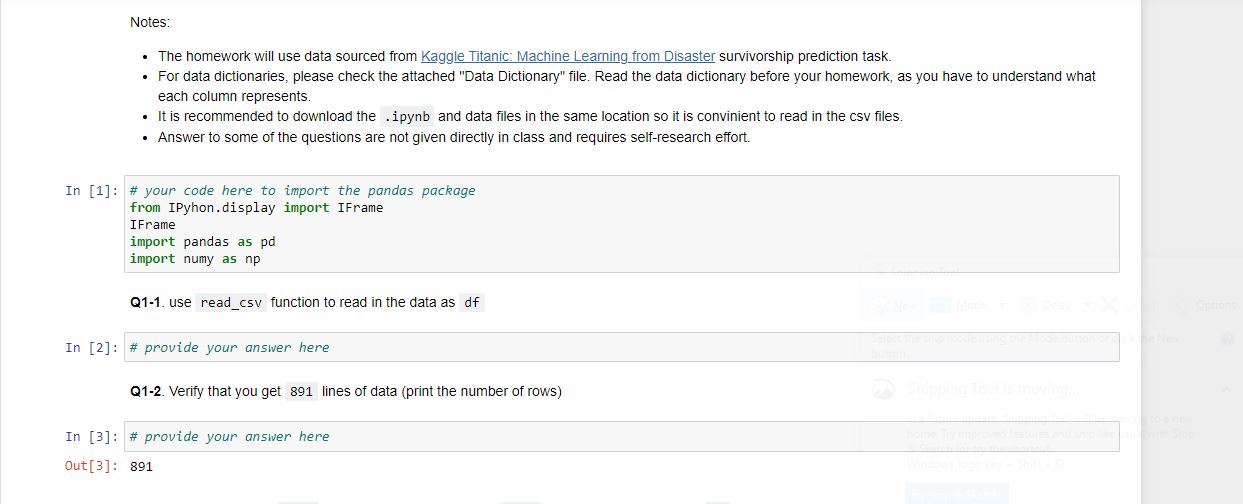
Q1-1. use read_csv function to read in the data as df
Q1-2. Verify that you get 891 lines of data (print the number of rows)
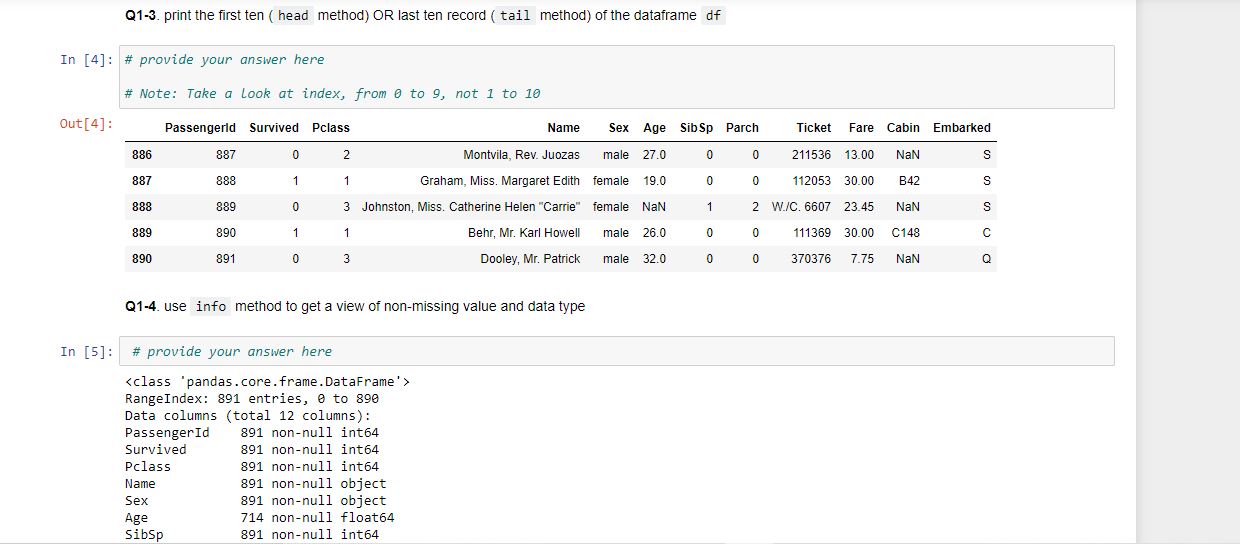
Q1-3. print the first ten (head method) OR last ten record (tail method) of the dataframe df
Q1-4. use info method to get a view of non-missing value and data type
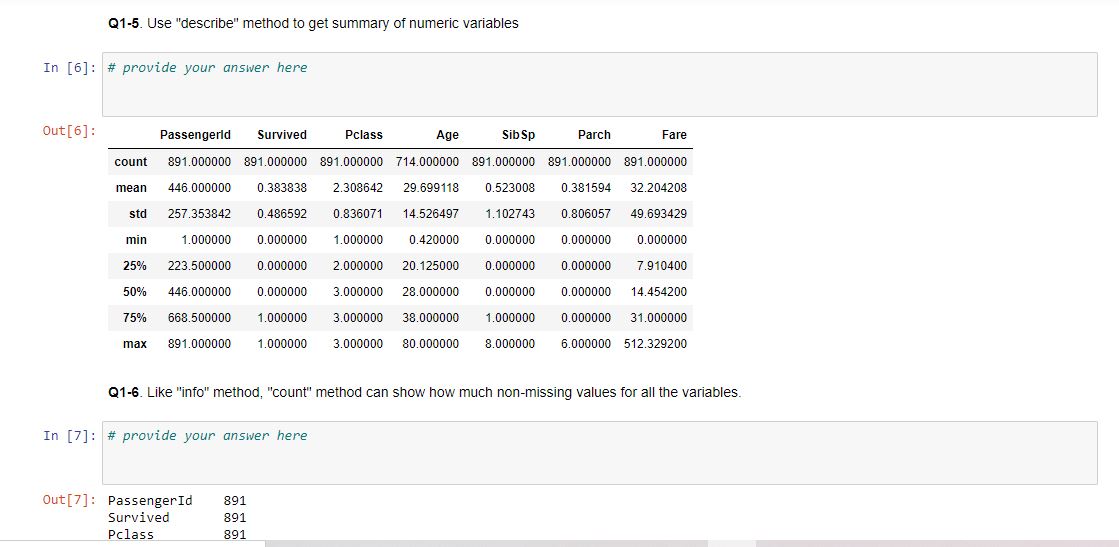
Q1-5. Use "describe" method to get summary of numeric variables
Q1-6. Like "info" method, "count" method can show how much non-missing values for all the variables.
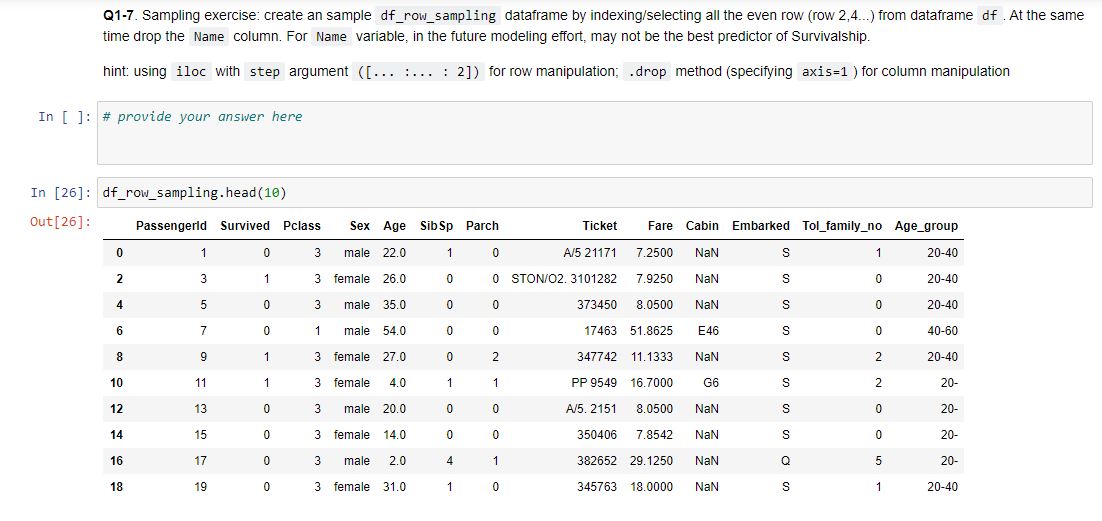
Q1-7. Sampling exercise: create an sample df_row_sampling dataframe by indexing/selecting all the even row (row 2,4...) from dataframe df. At the same time drop the Name column. For Name variable, in the future modeling effort, may not be the best predictor of Survivalship.
hint: using iloc with step argument ([... :... : 2]) for row manipulation; .drop method (specifying axis=1) for column manipulation
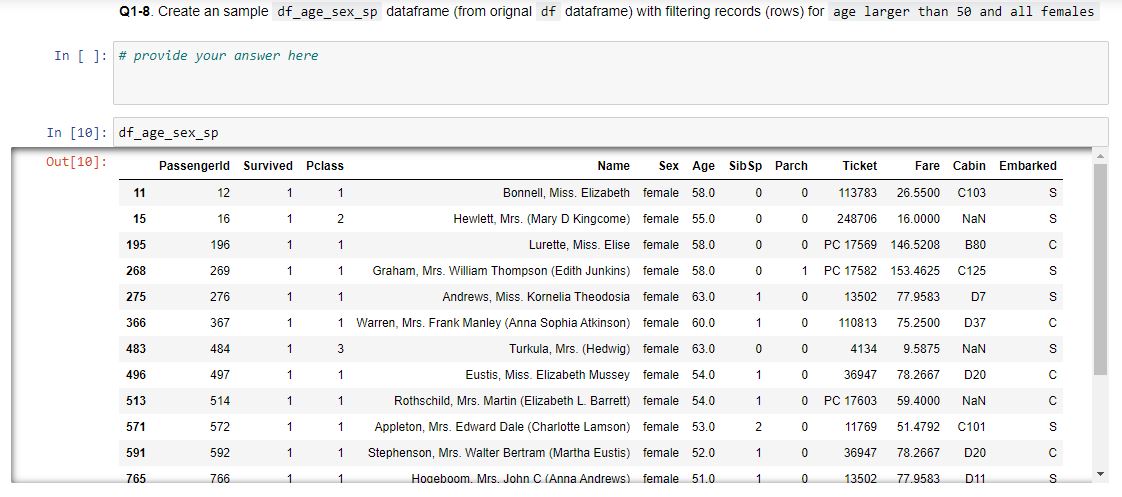
Q1-8. Create an sample df_age_sex_sp dataframe (from orignal df dataframe) with filtering records (rows) for age larger than 50 and all females.
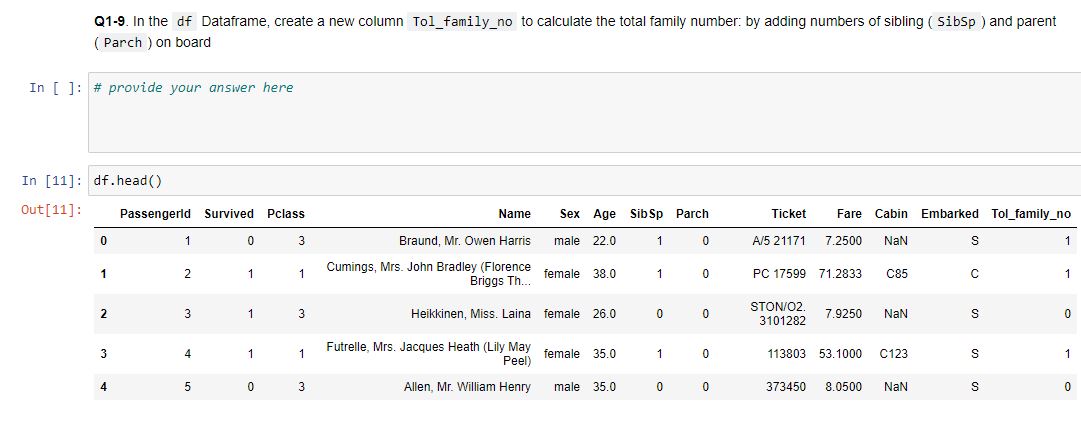
Q1-9. In the df Dataframe, create a new column Tol_family_no to calculate the total family number: by adding numbers of sibling (SibSp) and parent (Parch) on board.
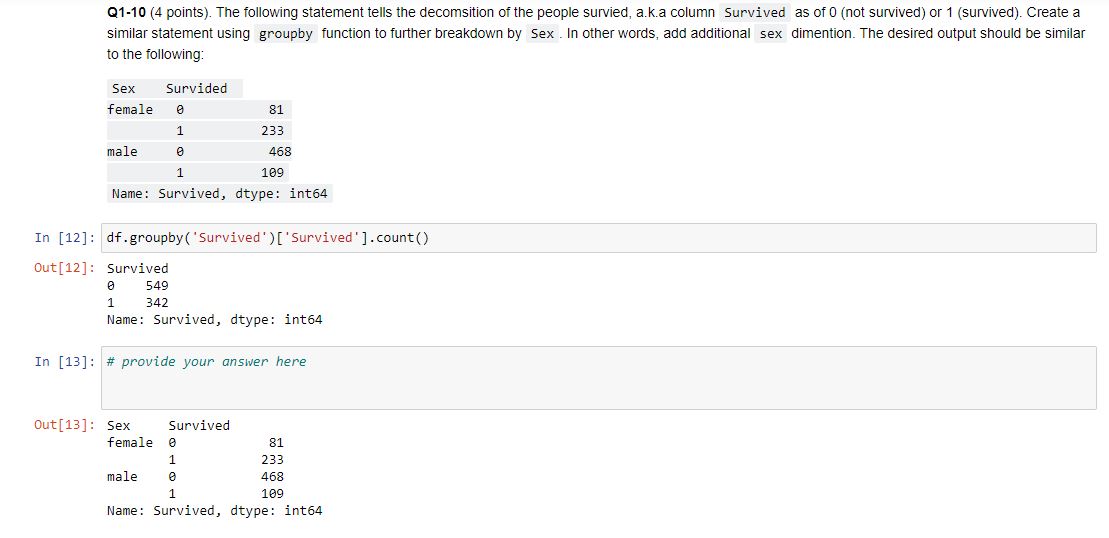
Q1-10 (4 points). The following statement tells the decomsition of the people survied, a.k.a column Survived as of 0 (not survived) or 1 (survived). Create a similar statement using groupby function to further breakdown by Sex. In other words, add additional sex dimention. The desired output should be similar to the following:
Sex Survided
female 0 81
1 233
male 0 468
1 109 Name: Survived, dtype: int64
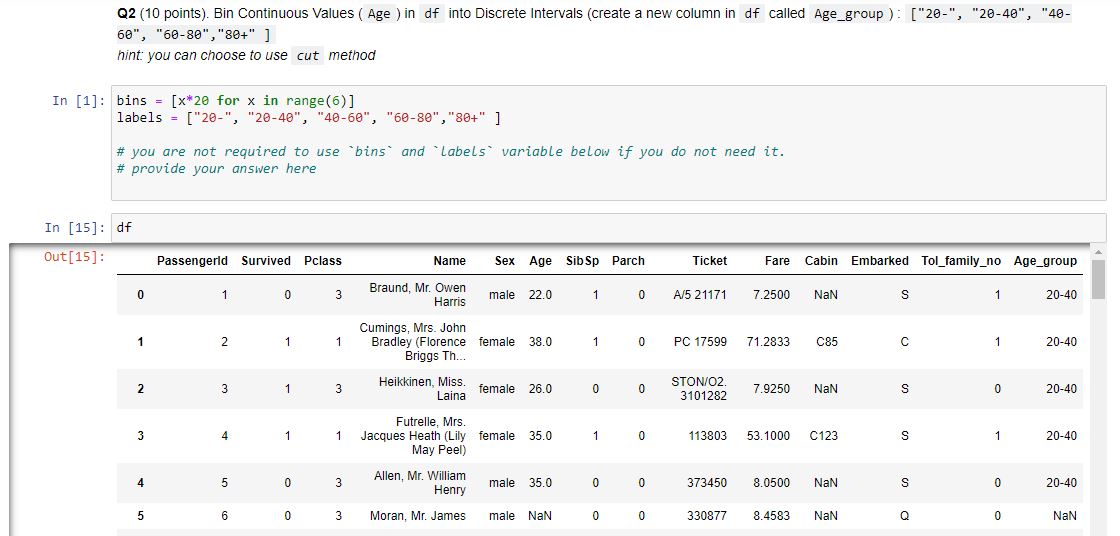
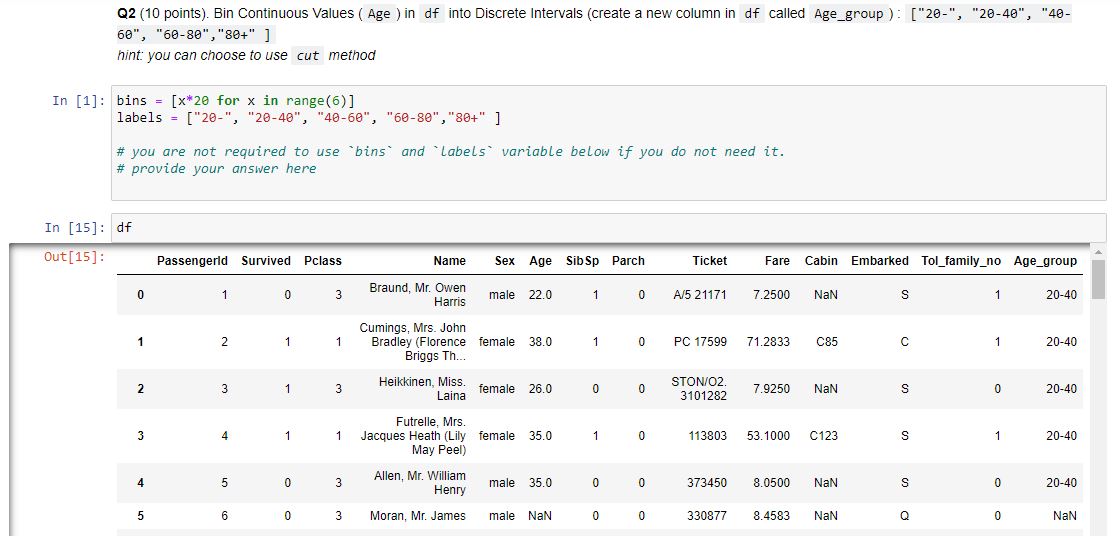
Q2 (10 points). Bin Continuous Values (Age) in df into Discrete Intervals (create a new column in df called Age_group) : ["20-", "20-40", "40-60", "60-80","80+" ] hint: you can choose to use cut method
Q3 (4 points). Using df, create a pivot table to see survived numbers by age_group and sex. The desired output is similar to the following:
Sex female male
Age_group
20- 53 29
20-40 107 46
40-60 34 16
60-80 3 2
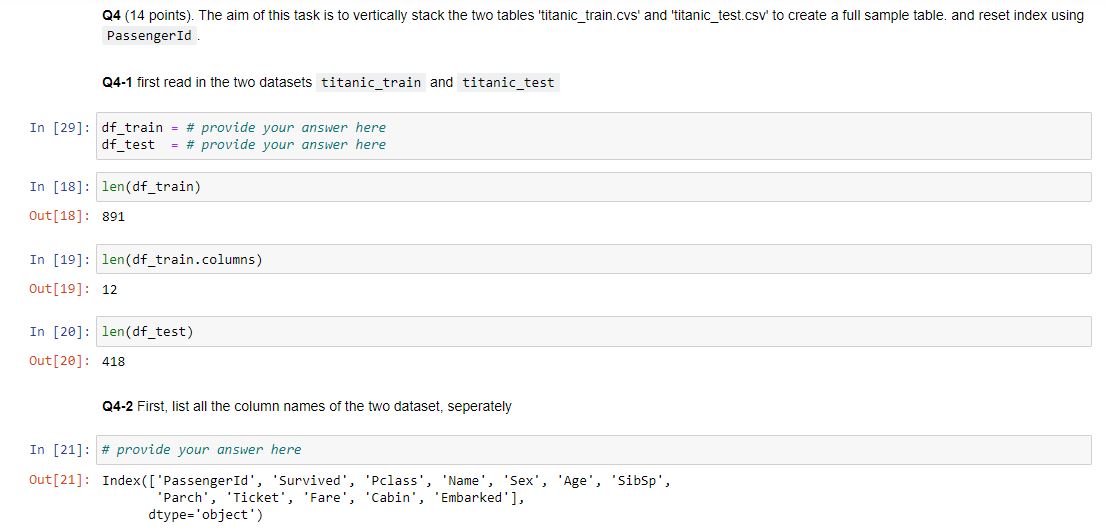
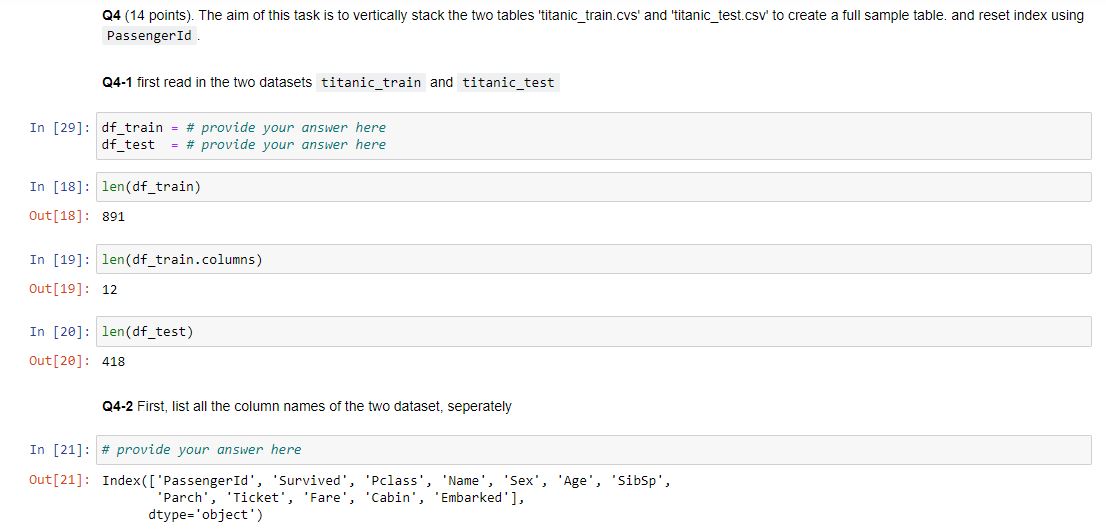
Q4 (14 points). The aim of this task is to vertically stack the two tables 'titanic_train.cvs' and 'titanic_test.csv' to create a full sample table. and reset index using PassengerId.
Q4-1 first read in the two datasets titanic_train and titanic_test
Q4-2 First, list all the column names of the two dataset, seperately
Q4-3 First, let's create a new column (use insert method) Survived of -1 to test dataset as place holder. Make sure it is inserted as the second column Hint: insert method modifies the original data df_test
Q4-4 Explore using concat,merge or melt function to stack the two data set vertically. Try different settings and see which function(s) works the best. Name the final results dataset df_full. df_full should have len(df_train) + len(df_test) = 1309 rows and len(df_train.columns) = 12 columns.
![iloc with step argument ([... :... : 2]) for row manipulation; .drop](https://dsd5zvtm8ll6.cloudfront.net/si.experts.images/questions/2024/09/66f01584b437d_18066f0158440158.jpg)

Notes: The homework will use data sourced from Kaggle Titanic: Machine Learning from Disaster survivorship prediction task. For data dictionaries, please check the attached "Data Dictionary" file. Read the data dictionary before your homework, as you have to understand what each column represents. It is recommended to download the .ipynb and data files in the same location so it is convinient to read in the csv files. Answer to some of the questions are not given directly in class and requires self-research effort. In [1]: # your code here to import the pandas package from IPyhon.display import IFrame IFrame import pandas as pd import numy as np Q1-1. use read_csv function to read in the data as df In [2]: # provide your answer here Q1-2. Verify that you get 891 lines of data (print the number of rows) In [3]: # provide your answer here Out[3]: 891 Q1-3. print the first ten ( head method) OR last ten record (tail method) of the dataframe df In [4]: # provide your answer here # Note: Take a look at index, from 0 to 9, not 1 to 10 Out[4]: Passengerld Survived Pclass Ticket Fare Cabin Embarked 886 887 0 2 Name Sex Age Sib Sp Parch Montvila, Rev. Juozas male 27.0 0 0 Graham, Miss, Margaret Edith female 19.0 0 0 211536 13.00 NaN S 887 888 1 1 112053 30.00 B42 S 888 889 0 1 2 W./C. 6607 23.45 NaN S 3 Johnston, Miss. Catherine Helen "Carrie" female NaN 1 Behr, Mr. Karl Howell male 26.0 889 890 1 1 0 0 111369 30.00 C148 890 891 0 3 Dooley, Mr. Patrick male 32.0 0 0 370376 7.75 NaN Q Q1-4. use info method to get a view of non-missing value and data type In [5]: # provide your answer here Range Index: 891 entries, to 890 Data columns (total 12 columns): PassengerId 891 non-null int64 Survived 891 non-null int64 Pclass 891 non-null int64 Name 891 non-null object Sex 891 non-null object Age 714 non-null float64 Sibsp 891 non-null int64 Q1-5. Use "describe" method to get summary of numeric variables In [6]: # provide your answer here Out[6]: count Passengerld Survived Pclass Age Sib Sp Parch Fare 891.000000 891.000000 891.000000 714.000000 891.000000 891.000000 891.000000 446.000000 0.383838 2.308642 29.699118 0.523008 0.381594 32.204208 mean std 257.353842 0.486592 0.836071 14.526497 1.102743 0.806057 49.693429 min 1.000000 0.000000 0.000000 0.000000 0.000000 25% 223.500000 0.000000 0.000000 0.000000 7.910400 50% 446.000000 0.000000 1.000000 0.420000 2.000000 20.125000 3.000000 28.000000 3.000000 38.000000 3.000000 80.000000 0.000000 0.000000 14.454200 75% 668.500000 1.000000 1.000000 0.000000 31.000000 6.000000 512.329200 max 891.000000 1.000000 8.000000 Q1-6. Like "info" method, "count" method can show how much non-missing values for all the variables. In [7]: # provide your answer here Out[7]: PassengerId Survived Pclass 891 891 891 Q1-7. Sampling exercise: create an sample df_row_sampling dataframe by indexing/selecting all the even row (row 2,4...) from dataframe of At the same time drop the Name column. For Name variable, in the future modeling effort, may not be the best predictor of Survivalship. hint: using iloc with step argument ([...:... : 2]) for row manipulation, .drop method (specifying axis=1 ) for column manipulation In [ ]: # provide your answer here In [26]: df_row_sampling. head (10) Out[26]: Passengerld Survived Pclass Sex Age Sib Sp Parch Ticket Fare Cabin Embarked Tol_family_no Age_group 7.2500 NaN S 1 20-40 0 1 0 3 male 22.0 1 0 A/5 21171 2 3 1 3 female 26.0 0 0 STON/O2. 3101282 7.9250 NaN S 0 20-40 4 5 0 3 male 35.0 0 0 373450 8.0500 NaN S 0 20-40 6 7 0 1 male 54.0 0 0 17463 51.8625 E46 S 0 40-60 8 9 1 3 female 27.0 0 2 347742 11.1333 NaN S 2 20-40 10 11 1 3 female 4.0 1 1 PP 9549 16.7000 G6 S 2 20- 12 13 0 3 male 20.0 0 0 A/5. 2151 / 8.0500 NaN S 0 20- 14 15 0 3 female 14.0 0 0 350406 7.8542 NaN S 0 20- 16 17 0 3 male 2.0 4 1 382652 29.1250 NaN Q 5 20- 18 19 0 3 female 31.0 1 0 345763 18.0000 NaN S 1 20-40 Q1-8. Create an sample df_age_sex_sp dataframe (from orignal df dataframe) with filtering records (rows) for age larger than 50 and all females In [ ]: # provide your answer here In [10]: df_age_sex_sp Out[10]: Passengerld Survived Pclass Name Sex Age SibSp Parch Ticket Fare Cabin Embarked 11 12 1 1 1 Bonnell, Miss. Elizabeth female 58.0 0 0 113783 26.5500 C103 S 15 16 1 2 0 0 248706 16.0000 NaN S Hewlett, Mrs. (Mary D Kingcome) female 55.0 Lurette, Miss. Elise female 58.0 195 196 1 1 0 0 PC 17569 146.5208 B80 268 269 1 1 Graham, Mrs. William Thompson (Edith Junkins) female 58.0 0 1 PC 17582 153.4625 C125 S 275 276 1 1 Andrews, Miss. Kornelia Theodosia female 63.0 1 0 0 13502 77.9583 D7 S 366 367 1 1 Warren, Mrs. Frank Manley (Anna Sophia Atkinson) female 60.0 1 0 110813 75.2500 D37 483 484 1 3 Turkula, Mrs. (Hedwig) female 63.0 0 0 4134 9.5875 NaN S 496 497 1 1 Eustis, Miss Elizabeth Mussey female 54.0 1 0 36947 78.2667 D20 513 514 1 1 Rothschild, Mrs. Martin (Elizabeth L. Barrett) female 54.0 1 0 PC 17603 59.4000 NaN 571 572 1 1 Appleton, Mrs. Edward Dale (Charlotte Lamson) female 53.0 2 0 11769 51.4792 C101 S 591 592 1 1 1 0 36947 78.2667 D20 Stephenson, Mrs. Walter Bertram (Martha Eustis) female 52.0 Hogeboom. Mrs. John C (Anna Andrews) female 51.0 765 766 1, 1 1 0 13502 77.9583 D11 S Q1-9. In the df Dataframe, create a new column Tol_family_no to calculate the total family number: by adding numbers of sibling ( Sibsp ) and parent (Parch) on board In [ ]: # provide your answer here In [11]: df.head() Out[11]: Passengerld Survived Pclass Name Sex Age Sib Sp Parch Ticket Fare Cabin Embarked Tol_family_no 0 1 0 3 1 0 A/5 21171 7.2500 NaN S 1 Braund, Mr. Owen Harris male 22.0 Cumings, Mrs. John Bradley (Florence female 38.0 Briggs Th. 1 2 1 1 1 0 PC 17599 71.2833 C85 1 2 3 1 3 Heikkinen, Miss. Laina female 26.0 0 0 STON/O2 3101282 7.9250 NaN S 0 3 4 1 1 Futrelle, Mrs. Jacques Heath (Lily May female 35.0 Peel) 1 0 113803 53.1000 C123 S 1 4 5 0 3 Allen, Mr. William Henry male 35.0 0 0 373450 8.0500 NaN S 0 Q1-10 (4 points). The following statement tells the decomsition of the people survied, a.k.a column Survived as of 0 (not survived) or 1 (survived). Create a similar statement using groupby function to further breakdown by Sex. In other words, add additional sex dimention. The desired output should be similar to the following: Sex Survided female 0 81 1 233 male 0 468 1 109 Name: Survived, dtype: int64 In [12]: df.groupby('Survived')['Survived').count() Out[12]: Survived 0 549 1 342 Name: Survived, dtype: int64 In [13]: # provide your answer here Out[13]: Sex Survived female 0 81 1 233 male @ 468 109 Name: Survived, dtype: int64 Q2 (10 points). Bin Continuous Values ( Age ) in df into Discrete Intervals (create a new column in df called Age_group): ["20-", "20-40", "40- 60", "60-80","80+" ] hint: you can choose to use cut method In [1]: bins = [x*20 for x in range(6)] labels = ["20-", "20-40", "40-60", "60-80","80+" ] # you are not required to use 'bins' and 'Labels variable below if you do not need it. # provide your answer here In [15]: df Out[15]: Passengerld Survived Pclass Name Sex Age Sib Sp Parch Ticket Fare Cabin Embarked Tol_family_no Age_group 0 1 0 3 Braund, Mr. Owen Harris male 22.0 1 0 A/5 21171 7.2500 NaN S 1 20-40 1 2 1 1 Cumings, Mrs. John Bradley (Florence female 38.0 Briggs Th... 1 0 PC 17599 71.2833 C85 1 20-40 2 3 1 3 Heikkinen, Miss. Laina female 26.0 0 0 STON/O2 3101282 7.9250 NaN S 0 20-40 3 4 1 1 Futrelle, Mrs. Jacques Heath (Lily female May Peel) 35.0 1 0 113803 53.1000 C123 S 1 20-40 4 5 0 3 Allen, Mr. William Henry male 35.0 373450 8.0500 NaN S 0 20-40 5 6 03 Moran, Mr. James male NaN 0 0 330877 8.4583 NaN Q 0 NaN Q2 (10 points). Bin Continuous Values ( Age ) in df into Discrete Intervals (create a new column in df called Age_group): ["20-", "20-40", "40- 60", "60-80","80+" ] hint: you can choose to use cut method In [1]: bins = [x*20 for x in range(6)] labels = ["20-", "20-40", "40-60", "60-80","80+" ] # you are not required to use 'bins' and 'Labels variable below if you do not need it. # provide your answer here In [15]: df Out[15]: Passengerld Survived Pclass Name Sex Age Sib Sp Parch Ticket Fare Cabin Embarked Tol_family_no Age_group 0 1 0 3 Braund, Mr. Owen Harris male 22.0 1 0 A/5 21171 7.2500 NaN S 1 20-40 1 2 1 1 Cumings, Mrs. John Bradley (Florence female 38.0 Briggs Th... 1 0 PC 17599 71.2833 C85 1 20-40 2 3 1 3 Heikkinen, Miss. Laina female 26.0 0 0 STON/O2 3101282 7.9250 NaN S 0 20-40 3 4 1 1 Futrelle, Mrs. Jacques Heath (Lily female May Peel) 35.0 1 0 113803 53.1000 C123 S 1 20-40 4 5 0 3 Allen, Mr. William Henry male 35.0 373450 8.0500 NaN S 0 20-40 5 6 03 Moran, Mr. James male NaN 0 0 330877 8.4583 NaN Q 0 NaN Q4 (14 points). The aim of this task is to vertically stack the two tables 'titanic_train.cvs' and 'titanic_test.csv' to create a full sample table, and reset index using PassengerId. Q4-1 first read in the two datasets titanic_train and titanic_test In [29]: df_train = # provide your answer here df_test = # provide your answer here In [18]: len(df_train) Out[18]: 891 In [19]: len(df_train.columns) Out[19]: 12 In [20]: len(df_test) Out[20]: 418 Q4-2 First, list all the column names of the two dataset, seperately In [21]: # provide your answer here Out[21]: Index(['PassengerId', 'Survived', 'Pclass', 'Name', 'sex', 'Age', 'Sibsp', 'Parch', 'Ticket', 'Fare', 'Cabin', 'Embarked'], dtype='object) Q4 (14 points). The aim of this task is to vertically stack the two tables 'titanic_train.cvs' and 'titanic_test.csv' to create a full sample table, and reset index using PassengerId. Q4-1 first read in the two datasets titanic_train and titanic_test In [29]: df_train = # provide your answer here df_test = # provide your answer here In [18]: len(df_train) Out[18]: 891 In [19]: len(df_train.columns) Out[19]: 12 In [20]: len(df_test) Out[20]: 418 Q4-2 First, list all the column names of the two dataset, seperately In [21]: # provide your answer here Out[21]: Index(['PassengerId', 'Survived', 'Pclass', 'Name', 'sex', 'Age', 'Sibsp', 'Parch', 'Ticket', 'Fare', 'Cabin', 'Embarked'], dtype='object) In [22]: # provide your answer here Out[22]: Index(['PassengerId', 'Pclass', 'Name', 'sex', 'Age', 'SibSp', 'Parch', 'Ticket', 'Fare', 'Cabin', 'Embarked'], dtype='object) Note the only differnce is the column named Survived which only exist in train data but not the test data. This is because the test data is used to predict the Survived field using machine learning modeling techniques (which we will cover in later class). Sometimes we will want to join the tables to take a look at some characteristics of the full sample to investigation purpose. This is why we may want to stack the data set. Q4-3 First, let's create a new column (use insert method) Survived of -1 to test dataset as place holder. Make sure it is inserted as the second column Hint: insert method modifies the original data df_test In [ ]: # provide your answer here In [30]: #take a look again at the df test with the additional column df_test.head() Out[30]: Passengerld Survived Pclass Name Sex Age 892 - 1 3 Kelly, Mr. James male 34.5 893 -1 3 Wilkes, Mrs. James (Ellen Needs) female 47.0 Sib Sp Parch Ticket Fare Cabin Embarked 0 0 0 330911 7.8292 NaN Q 1 1 0 363272 7.0000 NaN S 2 894 -1 2 Myles, Mr. Thomas Francis male 62.0 0 0 240276 9.6875 NaN Q Q4-4 Explore using concat , merge or melt function to stack the two data set vertically. Try different settings and see which function(s) works the best. Name the final results dataset df_full. df_full should have len(df_train) + len(df_test) = 1309 rows and len(df_train.columns) = 12 columns In [2] : # provide your answer here Q4-5 last, in the newly created df_full data, reset the index using PassengerId column In [1]: # provide your answer here In [ ]


![iloc with step argument ([... :... : 2]) for row manipulation; .drop](https://dsd5zvtm8ll6.cloudfront.net/si.experts.images/questions/2024/09/66f01584b437d_18066f0158440158.jpg)


