

Answered step by step
Verified Expert Solution
Question
1 Approved Answer
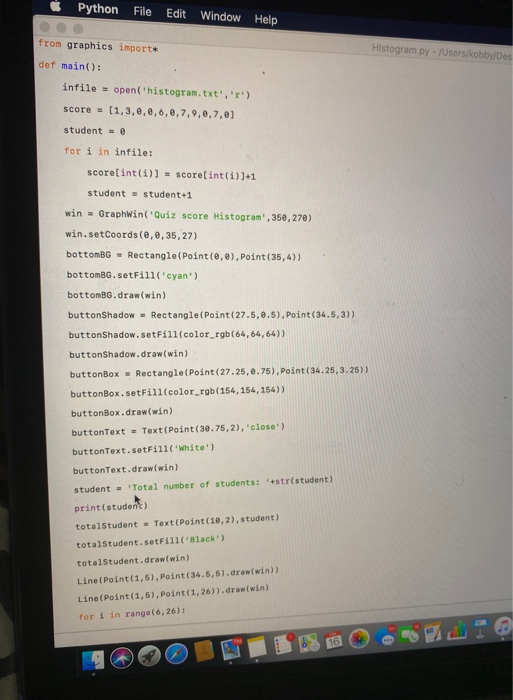
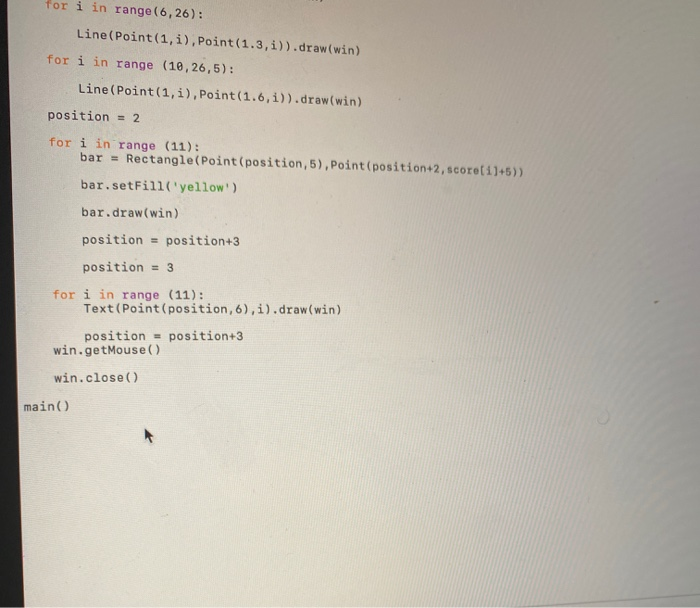
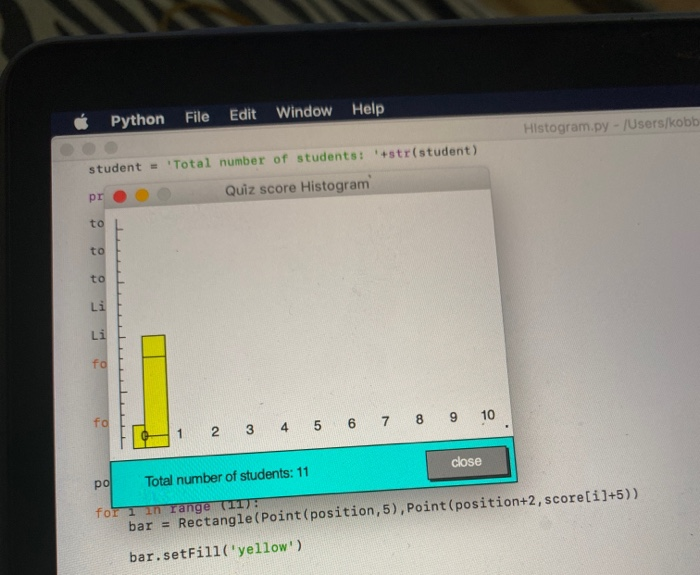
python....This is where i got to..When i run my code it does seem to appear like what's in the question pls check my code for
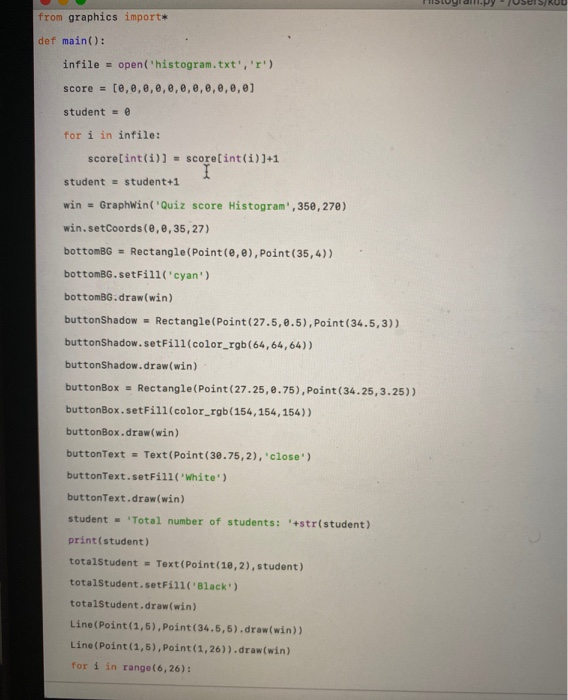
python....This is where i got to..When i run my code it does seem to appear like what's in the question pls check my code for me .... 
this is the question...python 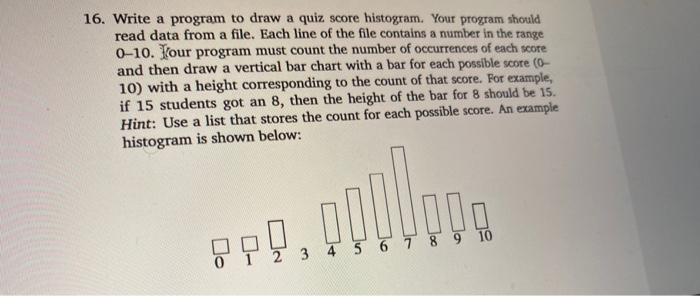
115Uydullpy Users/RUU from graphics import* def main(): infile = open('histogram.txt','1') score = [0,0,0,0,0,0,0,0,0,0,0] student = 0 for i in infile: score[int(i)] = score[int(i))+1 student = student+1 win = GraphWin('Quiz score Histogram', 350,270) win.setCoords(0, 0,35,27) bottomBG = Rectangle(Point(0,0), Point(35,4)) bottomBG.setFill('cyan') bottomBG.draw(win) buttonShadow - Rectangle(Point(27.5, 0.5), Point(34.5,3)) buttonShadow.setFill(color_rgb(64, 64, 64)) buttonShadow.draw(win) buttonBox = Rectangle(Point (27.25, 0.75), Point(34.25, 3.25)) buttonBox. setFill(color_rgb(154, 154, 154)) buttonBox.draw(win) buttonText - Text (Point(30.75,2), 'close') buttonText. setFill(white) buttonText.draw(win) student = 'Total number of students: *+str(student) print(student) totalStudent = Text (Point (10,2), student) totalStudent.setFill(Black) totalStudent.draw(win) Line(Point(1,5), Point(34.5,5).draw(win)) Line(Point(1,5), Point(1,26)).draw(win) for i in range(6,26): 16. Write a program to draw a quiz score histogram. Your program should read data from a file. Each line of the file contains a number in the range 0-10. Hour program must count the number of occurrences of each score and then draw a vertical bar chart with a bar for each possible score (0- 10) with a height corresponding to the count of that score. For example, if 15 students got an 8, then the height of the bar for 8 should be 15. Hint: Use a list that stores the count for each possible score. An example histogram is shown below: 8P], opo 9 10 7 8 3 4 5 6 Python File Edit Window Help from graphics import* Histogram.py - /Users/kobby Des def main(): infile = open('histogram.txt', 'r') score = (1,3,0,0,6,6,7,9,6,7,0) student = 0 for i in infile: score[int(i)] = score[int(i)]+1 student = student+1 win = Graphwin'Quiz score Histogram., 35e,270) win.setCoords(0, 0,35,27) bottomBG - Rectangle(Point(e,e), Point(35,4)) bottomBG. setFill('cyan) bottomBG.draw(win) buttonShadow - Rectangle(Point(27.5, 0.5), Point(34.5,3)) buttonShadow. setFill(color_rgb(64,64,64)) buttonShadow.draw(win) buttonBox - Rectangle(Point(27.25, 0.75), Point(34.25, 3.25) buttonBox. setFill(color_rgb(154, 154, 154)) buttonBox.draw(win) buttonText = Text(Point(30.75,2), 'close) buttonText. setFill(white) buttonText.draw(win) student = Total number of students: 'str(student) print (student) totalStudent - Text (Point (10,2), student) totalStudent.setFill(Black) totalStudent.draw(win) Line(Point(1,5), Point(34.5,5).draw(win)) Line(Point(1,5), Point(1,26)).draw(win) for i in range(6,26): for i in range(6,26): Line(Point(1, i), Point(1.3, i)).draw(win) for i in range (10,26,5): Line(Point(1, i), Point(1.6, i)).draw(win) position = 2 for i in range (11): bar = Rectangle(Point(position,5), Point(position2, score[i]+5)) bar.setFill(yellow) bar.draw(win) position = position+3 position = 3 for i in range (11): Text (Point(position, 6), i).draw(win) position = position+3 win.getMouse() win.close() main() Python File Edit Help Window Histogram.py - /Users/kobb student - Total number of students: '+str(student) Quiz score Histogram 1 2 3 4 5 6 7 8 9 10 close Total number of students: 11 for Tm range 001 bar = Rectangle(Point(position,5), Point(position+2, score[i]+5)) bar.setFill(yellow) 16. Write a program to draw a quiz score histogram. Your program should read data from a file. Each line of the file contains a number in the range 0-10. Hour program must count the number of occurrences of each score and then draw a vertical bar chart with a bar for each possible score (0- 10) with a height corresponding to the count of that score. For example, if 15 students got an 8, then the height of the bar for 8 should be 15. Hint: Use a list that stores the count for each possible score. An example histogram is shown below: 8P], opo 9 10 7 8 3 4 5 6 Step by Step Solution
There are 3 Steps involved in it
Step: 1

Get Instant Access to Expert-Tailored Solutions
See step-by-step solutions with expert insights and AI powered tools for academic success
Step: 2

Step: 3
Ace Your Homework with AI
Get the answers you need in no time with our AI-driven, step-by-step assistance
Get Started
User Defined Tensor Data Analysis
Authors: Bin Dong ,Kesheng Wu ,Suren Byna
1st Edition
3030707490, 978-3030707491