

Question
Q 1.) A Six Sigma team is testing pilot test results to see if they have made a ststistically significant improvement. They need to test
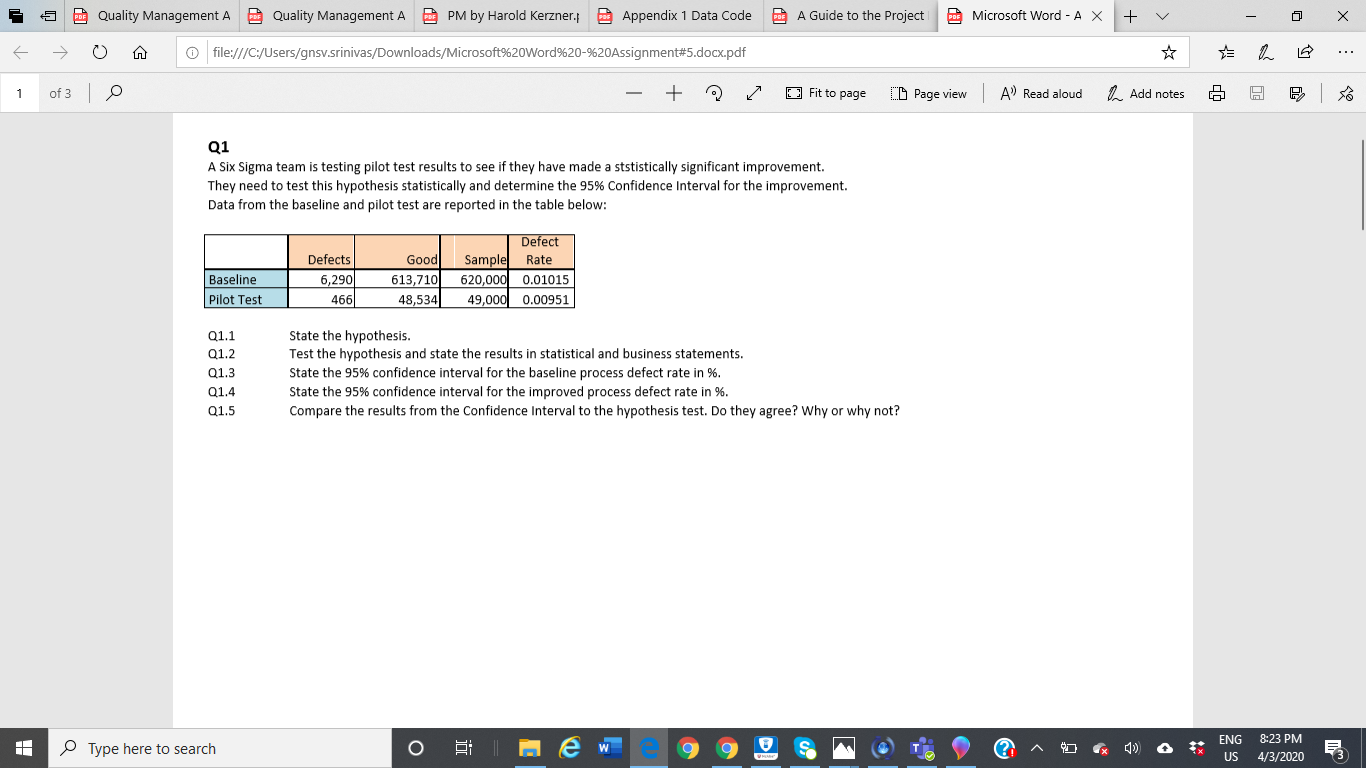
Q 1.) A Six Sigma team is testing pilot test results to see if they have made a ststistically significant improvement. They need to test this hypothesis statistically and determine the 95% Confidence Interval for the improvement. Data from the baseline and pilot test are reported in the table below:
Q1.1 State the hypothesis.
Q1.2 Test the hypothesis and state the results in statistical and business statements.
Q1.3 State the 95% confidence interval for the baseline process defect rate in %.
Q1.4 State the 95% confidence interval for the improved process defect rate in %
. Q1.5 Compare the results from the Confidence Interval to the hypothesis test. Do they agree? Why or why not?
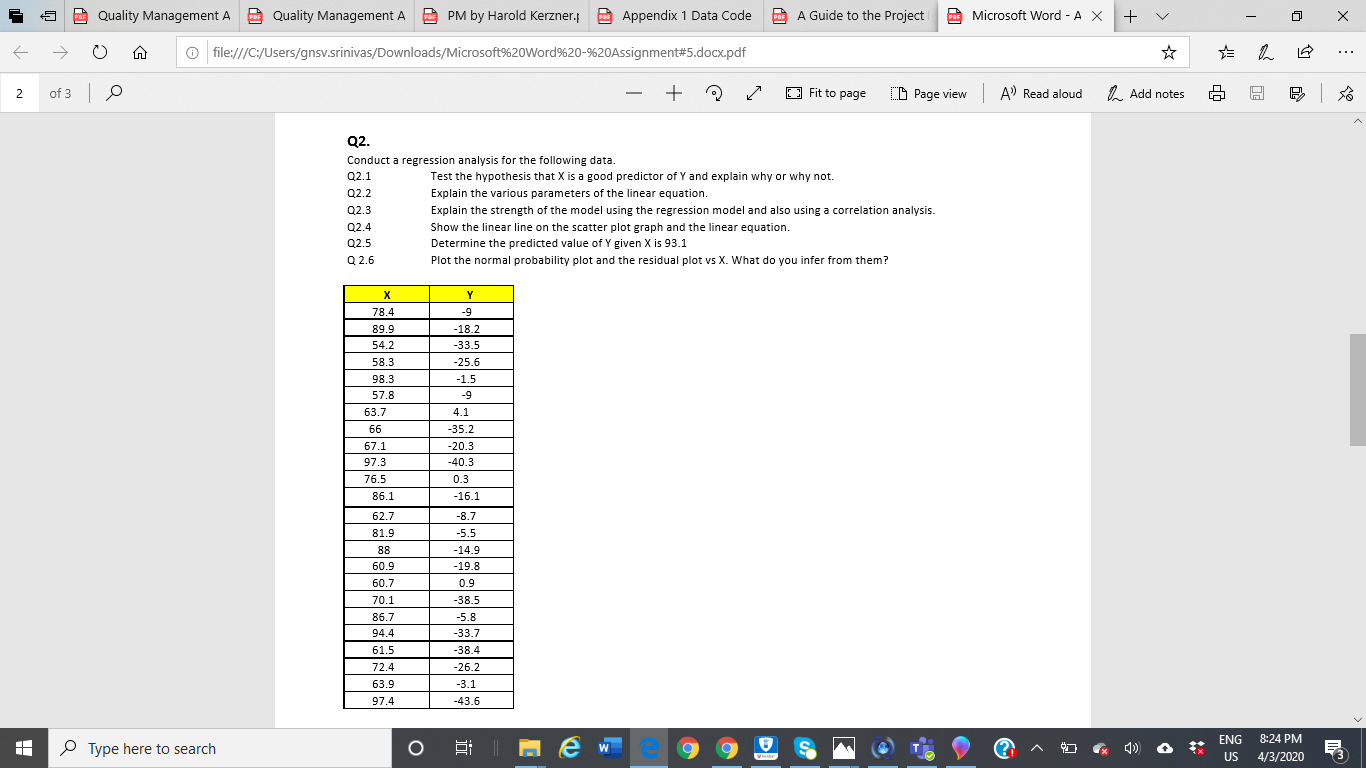
Q2. Conduct a regression analysis for the following data.
Q2.1 Test the hypothesis that X is a good predictor of Y and explain why or why not.
Q2.2 Explain the various parameters of the linear equation.
Q2.3 Explain the strength of the model using the regression model and also using a correlation analysis.
Q2.4 Show the linear line on the scatter plot graph and the linear equation.
Q2.5 Determine the predicted value of Y given X is 93.1 Q 2.6 Plot the normal probability plot and the residual plot vs X. What do you infer from them?
Q3
Q3.1 Explain how nuisance (noise) factors can affect data analysis and experiments in the Improve phase.
Q3.2 Explain how you would combat noise when it can be controlled.
Q3.3 Explain how you would combat noise when it can't be controlled.
Q3.4 Explain how you would use residual analysis in an ANOVA experiment.
Step by Step Solution
There are 3 Steps involved in it
Step: 1

Get Instant Access to Expert-Tailored Solutions
See step-by-step solutions with expert insights and AI powered tools for academic success
Step: 2

Step: 3
Ace Your Homework with AI
Get the answers you need in no time with our AI-driven, step-by-step assistance
Get Started
Elementary Linear Algebra with Applications
Authors: Bernard Kolman, David Hill
9th edition
132296543, 978-0132296540