

Answered step by step
Verified Expert Solution
Question
1 Approved Answer
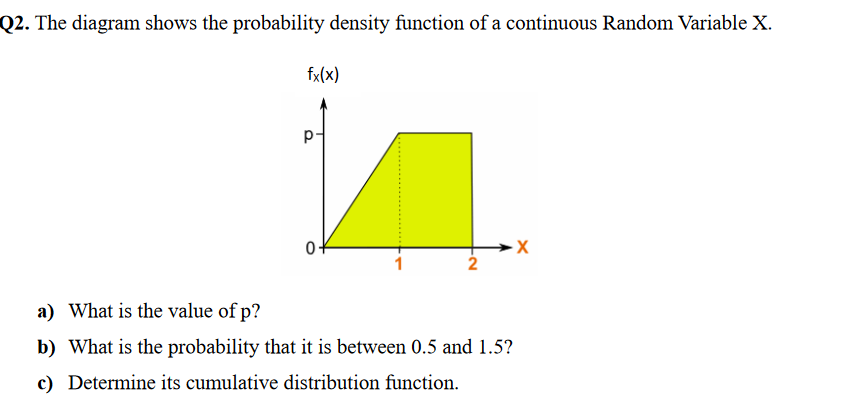
Q 2 . The diagram shows the probability density function of a continuous Random Variable x . a ) What is the value of p
Q The diagram shows the probability density function of a continuous Random Variable
a What is the value of
b What is the probability that it is between and
c Determine its cumulative distribution function.
Step by Step Solution
There are 3 Steps involved in it
Step: 1

Get Instant Access to Expert-Tailored Solutions
See step-by-step solutions with expert insights and AI powered tools for academic success
Step: 2

Step: 3
Ace Your Homework with AI
Get the answers you need in no time with our AI-driven, step-by-step assistance
Get Started
Functional Analysis And Summability
Authors: PN Natarajan
1st Edition
1000191494, 9781000191493