Answered step by step
Verified Expert Solution
Question
1 Approved Answer
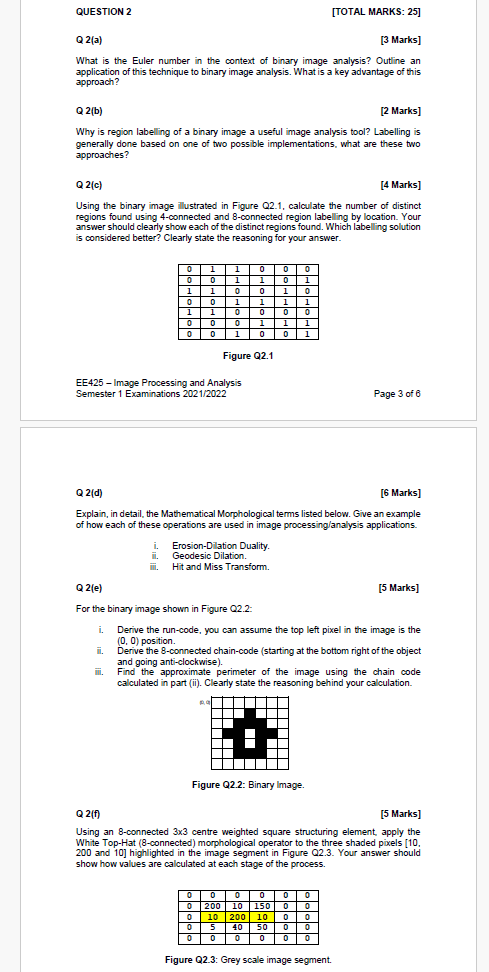
Q 2(a) [3 Marks] What is the Euler number in the context of binary image analysis? Outline an application of this technique to binary image
 Q 2(a) [3 Marks] What is the Euler number in the context of binary image analysis? Outline an application of this technique to binary image analysis. What is a key advantage of this approach? Q 2(b) [2 Marks] Why is region labelling of a binary image a useful image analysis tool? Labelling is generally done based on one of two possible implementations, what are these two approaches? Q 2(c) [4 Marks] Using the binary image Ilustrated in Figure Q2.1, calculate the number of distinct regions found using 4-connected and 8-connected region labelling by location. Your answer should clearly show each of the distinct regions found. Which labelling solution is considered better? Clearly state the reasoning for your answer. Figure Q2.1 EE425 - Image Processing and Analysis Semester 1 Examinations 2021/2022 Page 3 of 6 Q 2(d) [6 Marks] Explain, in detail, the Mathematical Morphological terms listed below. Give an example of how each of these operations are used in image processing/analysis applications. i. Erosion-Dilation Duality. ii. Geodesic Dilation. iii. Hit and Miss Transform. Q 2(e) [5 Marks] For the binary image shown in Figure Q2.2: i. Derive the run-code, you can assume the top left pixel in the image is the (0,0) position. ii. Derive the 8-connected chain-code (starting at the bottom right of the object and going anti-clockwise). iii. Find the approximate perimeter of the image using the chain code calculated in part (ii). Clearly state the reasoning behind your calculation. Figure Q2.2: Binary Image. Q 2(f) [5 Marks] Using an 8-connected 33 centre weighted square structuring element, apply the White Top-Hat (8-connected) morphological operator to the three shaded pixels [10. 200 and 10] highlighted in the image segment in Figure Q2.3. Your answer should show how values are calculated at each stage of the process. Figure Q2.3: Grey scale image segment
 Step by Step Solution
There are 3 Steps involved in it
Step: 1

Get Instant Access to Expert-Tailored Solutions
See step-by-step solutions with expert insights and AI powered tools for academic success
Step: 2

Step: 3

Ace Your Homework with AI
Get the answers you need in no time with our AI-driven, step-by-step assistance
Get Started


