

Answered step by step
Verified Expert Solution
Question
1 Approved Answer
Q: Calculate the upside & downside capture ratios for portfolios A & B. Use a 0% return for the S&P 500 to distinguish between up-
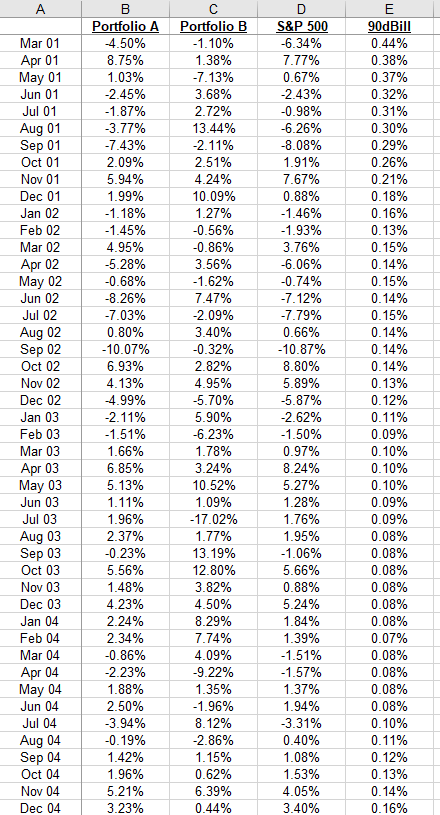
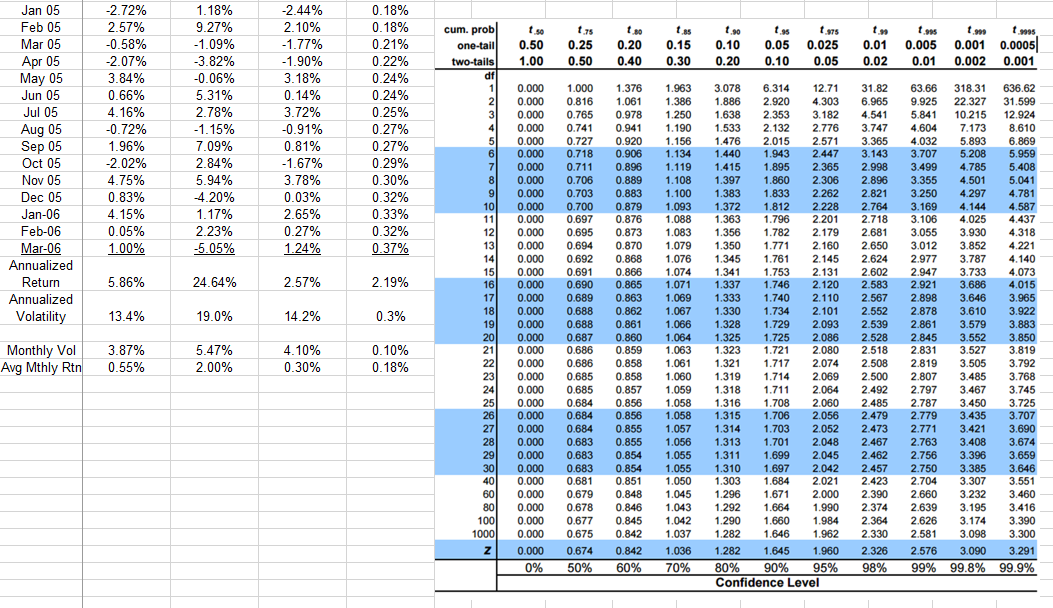
Q: Calculate the upside & downside capture ratios for portfolios A & B. Use a 0% return for the S&P 500 to distinguish between up- and down- market scenarios.
Portfolio A:
Portfolio B:
A Mar 01 Apr 01 May 01 Jun 01 Jul 01 Aug 01 Sep 01 Oct 01 Nov 01 Dec 01 Jan 02 Feb 02 Mar 02 Apr 02 May 02 Jun 02 Jul 02 Aug 02 Sep 02 Oct 02 Nov 02 Dec 02 Jan 03 Feb 03 Mar 03 Apr 03 May 03 Jun 03 Jul 03 Aug 03 Sep 03 Oct 03 Nov 03 Dec 03 Jan 04 Feb 04 Mar 04 Apr 04 May 04 Jun 04 Jul 04 Aug 04 Sep 04 Oct 04 Nov 04 Dec 04 B Portfolio A -4.50% 8.75% 1.03% -2.45% -1.87% -3.77% -7.43% 2.09% 5.94% 1.99% -1.18% -1.45% 4.95% -5.28% -0.68% -8.26% -7.03% 0.80% -10.07% 6.93% 4.13% 4.99% -2.11% -1.51% 1.66% 6.85% 5.13% 1.11% 1.96% 2.37% -0.23% 5.56% 1.48% 4.23% 2.24% 2.34% -0.86% -2.23% 1.88% 2.50% -3.94% -0.19% 1.42% 1.96% 5.21% 3.23% Portfolio B -1.10% 1.38% -7.13% 3.68% 2.72% 13.44% -2.11% 2.51% 4.24% 10.09% 1.27% -0.56% -0.86% 3.56% -1.62% 7.47% -2.09% 3.40% -0.32% 2.82% 4.95% -5.70% 5.90% -6.23% 1.78% 3.24% 10.52% 1.09% -17.02% 1.77% 13.19% 12.80% 3.82% 4.50% 8.29% 7.74% 4.09% -9.22% 1.35% -1.96% 8.12% -2.86% 1.15% 0.62% 6.39% 0.44% D S&P 500 -6.34% 7.77% 0.67% -2.43% -0.98% -6.26% -8.08% 1.91% 7.67% 0.88% -1.46% -1.93% 3.76% -6.06% -0.74% -7.12% -7.79% 0.66% -10.87% 8.80% 5.89% -5.87% -2.62% -1.50% 0.97% 8.24% 5.27% 1.28% 1.76% 1.95% -1.06% 5.66% 0.88% 5.24% 1.84% 1.39% -1.51% -1.57% 1.37% 1.94% -3.31% 0.40% 1.08% 1.53% 4.05% 3.40% E 90dBill 0.44% 0.38% 0.37% 0.32% 0.31% 0.30% 0.29% 0.26% 0.21% 0.18% 0.16% 0.13% 0.15% 0.14% 0.15% 0.14% 0.15% 0.14% 0.14% 0.14% 0.13% 0.12% 0.11% 0.09% 0.10% 0.10% 0.10% 0.09% 0.09% 0.08% 0.08% 0.08% 0.08% 0.08% 0.08% 0.07% 0.08% 0.08% 0.08% 0.08% 0.10% 0.11% 0.12% 0.13% 0.14% 0.16% t 50 0.50 1.00 0.75 0.25 0.50 t30 0.20 0.40 tas 0.15 0.30 t.30 0.10 0.20 tus 0.05 0.10 975 0.025 0.05 t. 0.01 0.02 t.99 t. toss 0.005 0.001 0.0005 0.01 0.002 0.001 31.82 6.965 4.541 Jan 05 Feb 05 Mar 05 Apr 05 May 05 Jun 05 Jul 05 Aug 05 Sep 05 Oct 05 Nov 05 Dec 05 Jan-06 Feb-06 Mar-06 Annualized Return Annualized -2.72% 2.57% -0.58% -2.07% 3.84% 0.66% 4.16% -0.72% 1.96% -2.02% 4.75% 0.83% 4.15% 0.05% 1.00% 1.18% 9.27% -1.09% -3.82% -0.06% 5.31% 2.78% -1.15% 7.09% 2.84% 5.94% 4.20% 1.17% 2.23% -5.05% -2.44% 2.10% -1.77% -1.90% 3.18% 0.14% 3.72% -0.91% 0.81% -1.67% 3.78% 0.03% 2.65% 0.27% 1.24% 0.18% 0.18% 0.21% 0.22% 0.24% 0.24% 0.25% 0.27% 0.27% 0.29% 0.30% 0.32% 0.33% 0.32% 0.37% 3.747 5.86% 24.64% 2.57% 2.19% cum. prob. one-tail two-tails df 1 21 3 4 5 6 7 71 8 9 10 11 12 13 14 15 16 17 18 19 20 21 22 23 24 25 26 27 28 29 30 40 60 80 100 1000 z Volatility 13.4% 19.0% 14.2% 0.3% 0.000 0.000 0.000 0.000 0.000 0.000 0.000 0.000 0.000 0.000 0.000 0.000 0.000 0.000 0.000 0.000 0.000 0.000 0.000 0.000 0.000 0.000 0.000 0.000 0.000 0.000 0.000 0.000 0.000 0.000 0.000 0.000 0.000 0.000 0.000 0.000 0% 1.000 0.816 0.765 0.741 0.727 0.718 0.711 0.706 0.703 0.700 0.697 0.695 0.694 0.692 0.691 0.690 0.689 0.688 0.688 0.687 0.686 0.686 0.685 0.685 0.684 0.684 0.684 0.683 0.683 0.683 0.681 0.679 0.678 0.677 0.675 0.674 50% 1.376 1.061 0.978 0.941 0.920 0.906 0.896 0.889 0.883 0.879 0.876 0.873 0.870 0.868 0.866 0.865 0.863 0.862 0.861 0.860 0.859 0.858 0.858 0.857 0.856 0.856 0.855 0.855 0.854 0.854 0.851 0.848 0.846 0.845 0.842 0.842 60% 1.963 1.386 1.250 1.190 1.156 1.134 1.119 1.108 1.100 1.093 1.088 1.083 1.079 1.076 1.074 1.071 1.069 1.067 1.066 1.064 1.063 1.061 1.060 1.059 1.058 1.058 1.057 1.056 1.055 1.055 1.050 1.045 1.043 1.042 1.037 1.036 70% 3.078 6.314 12.71 1.886 2.920 4.303 1.638 2.353 3.182 1.533 2.132 2.776 1.476 2.015 2.571 1.440 1.943 2.447 1.415 1.895 2.365 1.397 1.860 2.306 1.383 1.833 2.262 1.372 1.812 2.228 1.363 1.796 2.201 1.356 1.782 2.179 1.350 1.771 2.160 1.345 1.761 2.145 1.341 1.753 2.131 1.337 1.746 2.120 1.333 1.740 2.110 1.330 1.734 2.101 1.328 1.729 2.093 1.325 1.725 2.086 1.323 1.721 2.080 1.321 1.717 2.074 1.319 1.714 2.069 1.318 1.711 2.064 1.316 1.708 2.060 1.315 1.706 2.056 1.314 1.703 2.052 1.313 1.701 2.048 1.311 1.699 2.045 1.310 1.697 2.042 1.303 1.684 2.021 1.296 1.671 2.000 1.292 1.664 1.990 1.290 1.660 1.984 1.282 1.646 1.962 1.282 1.645 1.960 80% 90% 95% Confidence Level 63.66 318.31 636.62 9.925 22.327 31.599 5.841 10.215 12.924 4.604 7.173 8.610 4.032 5.893 6.869 3.707 5.208 5.959 3.499 4.785 5.408 3.355 4.501 5.041 3.250 4.297 4.781 3.169 4.144 4.587 3.106 4.025 4.437 3.055 3.930 4.318 3.012 3.852 4.221 2.977 3.787 4.140 2.947 3.733 4.073 2.921 3.686 4.015 2.898 3.646 3.965 2.878 3.610 3.922 2.861 3.579 3.883 2.845 3.552 3.850 2.831 3.527 3.819 2.819 3.505 3.792 2.807 3.485 3.768 2.797 3.467 3.745 2.787 3.450 3.725 2.779 3.435 3.707 2.771 3.421 3.690 2.763 3.408 3.674 2.756 3.396 3.659 2.750 3.385 3.646 2.704 3.307 3.551 2.660 3.232 3.460 2.639 3.195 3.416 2.626 3.174 3.390 2.581 3.098 3.300 2.576 3.090 3.291 99% 99.8% 99.9% 0.10% Monthly Vol Avg Mthly Rtn 3.87% 0.55% 5.47% 2.00% 3.365 3.143 2.998 2.896 2.821 2.764 2.718 2.681 2.650 2.624 2.602 2.583 2.567 2.552 2.539 2.528 2.518 2.508 2.500 2.492 2.485 2.479 2.473 2.467 2.462 2.457 2.423 2.390 2.374 2.364 2.330 2.326 98% 4.10% 0.30% 0.18% A Mar 01 Apr 01 May 01 Jun 01 Jul 01 Aug 01 Sep 01 Oct 01 Nov 01 Dec 01 Jan 02 Feb 02 Mar 02 Apr 02 May 02 Jun 02 Jul 02 Aug 02 Sep 02 Oct 02 Nov 02 Dec 02 Jan 03 Feb 03 Mar 03 Apr 03 May 03 Jun 03 Jul 03 Aug 03 Sep 03 Oct 03 Nov 03 Dec 03 Jan 04 Feb 04 Mar 04 Apr 04 May 04 Jun 04 Jul 04 Aug 04 Sep 04 Oct 04 Nov 04 Dec 04 B Portfolio A -4.50% 8.75% 1.03% -2.45% -1.87% -3.77% -7.43% 2.09% 5.94% 1.99% -1.18% -1.45% 4.95% -5.28% -0.68% -8.26% -7.03% 0.80% -10.07% 6.93% 4.13% 4.99% -2.11% -1.51% 1.66% 6.85% 5.13% 1.11% 1.96% 2.37% -0.23% 5.56% 1.48% 4.23% 2.24% 2.34% -0.86% -2.23% 1.88% 2.50% -3.94% -0.19% 1.42% 1.96% 5.21% 3.23% Portfolio B -1.10% 1.38% -7.13% 3.68% 2.72% 13.44% -2.11% 2.51% 4.24% 10.09% 1.27% -0.56% -0.86% 3.56% -1.62% 7.47% -2.09% 3.40% -0.32% 2.82% 4.95% -5.70% 5.90% -6.23% 1.78% 3.24% 10.52% 1.09% -17.02% 1.77% 13.19% 12.80% 3.82% 4.50% 8.29% 7.74% 4.09% -9.22% 1.35% -1.96% 8.12% -2.86% 1.15% 0.62% 6.39% 0.44% D S&P 500 -6.34% 7.77% 0.67% -2.43% -0.98% -6.26% -8.08% 1.91% 7.67% 0.88% -1.46% -1.93% 3.76% -6.06% -0.74% -7.12% -7.79% 0.66% -10.87% 8.80% 5.89% -5.87% -2.62% -1.50% 0.97% 8.24% 5.27% 1.28% 1.76% 1.95% -1.06% 5.66% 0.88% 5.24% 1.84% 1.39% -1.51% -1.57% 1.37% 1.94% -3.31% 0.40% 1.08% 1.53% 4.05% 3.40% E 90dBill 0.44% 0.38% 0.37% 0.32% 0.31% 0.30% 0.29% 0.26% 0.21% 0.18% 0.16% 0.13% 0.15% 0.14% 0.15% 0.14% 0.15% 0.14% 0.14% 0.14% 0.13% 0.12% 0.11% 0.09% 0.10% 0.10% 0.10% 0.09% 0.09% 0.08% 0.08% 0.08% 0.08% 0.08% 0.08% 0.07% 0.08% 0.08% 0.08% 0.08% 0.10% 0.11% 0.12% 0.13% 0.14% 0.16% t 50 0.50 1.00 0.75 0.25 0.50 t30 0.20 0.40 tas 0.15 0.30 t.30 0.10 0.20 tus 0.05 0.10 975 0.025 0.05 t. 0.01 0.02 t.99 t. toss 0.005 0.001 0.0005 0.01 0.002 0.001 31.82 6.965 4.541 Jan 05 Feb 05 Mar 05 Apr 05 May 05 Jun 05 Jul 05 Aug 05 Sep 05 Oct 05 Nov 05 Dec 05 Jan-06 Feb-06 Mar-06 Annualized Return Annualized -2.72% 2.57% -0.58% -2.07% 3.84% 0.66% 4.16% -0.72% 1.96% -2.02% 4.75% 0.83% 4.15% 0.05% 1.00% 1.18% 9.27% -1.09% -3.82% -0.06% 5.31% 2.78% -1.15% 7.09% 2.84% 5.94% 4.20% 1.17% 2.23% -5.05% -2.44% 2.10% -1.77% -1.90% 3.18% 0.14% 3.72% -0.91% 0.81% -1.67% 3.78% 0.03% 2.65% 0.27% 1.24% 0.18% 0.18% 0.21% 0.22% 0.24% 0.24% 0.25% 0.27% 0.27% 0.29% 0.30% 0.32% 0.33% 0.32% 0.37% 3.747 5.86% 24.64% 2.57% 2.19% cum. prob. one-tail two-tails df 1 21 3 4 5 6 7 71 8 9 10 11 12 13 14 15 16 17 18 19 20 21 22 23 24 25 26 27 28 29 30 40 60 80 100 1000 z Volatility 13.4% 19.0% 14.2% 0.3% 0.000 0.000 0.000 0.000 0.000 0.000 0.000 0.000 0.000 0.000 0.000 0.000 0.000 0.000 0.000 0.000 0.000 0.000 0.000 0.000 0.000 0.000 0.000 0.000 0.000 0.000 0.000 0.000 0.000 0.000 0.000 0.000 0.000 0.000 0.000 0.000 0% 1.000 0.816 0.765 0.741 0.727 0.718 0.711 0.706 0.703 0.700 0.697 0.695 0.694 0.692 0.691 0.690 0.689 0.688 0.688 0.687 0.686 0.686 0.685 0.685 0.684 0.684 0.684 0.683 0.683 0.683 0.681 0.679 0.678 0.677 0.675 0.674 50% 1.376 1.061 0.978 0.941 0.920 0.906 0.896 0.889 0.883 0.879 0.876 0.873 0.870 0.868 0.866 0.865 0.863 0.862 0.861 0.860 0.859 0.858 0.858 0.857 0.856 0.856 0.855 0.855 0.854 0.854 0.851 0.848 0.846 0.845 0.842 0.842 60% 1.963 1.386 1.250 1.190 1.156 1.134 1.119 1.108 1.100 1.093 1.088 1.083 1.079 1.076 1.074 1.071 1.069 1.067 1.066 1.064 1.063 1.061 1.060 1.059 1.058 1.058 1.057 1.056 1.055 1.055 1.050 1.045 1.043 1.042 1.037 1.036 70% 3.078 6.314 12.71 1.886 2.920 4.303 1.638 2.353 3.182 1.533 2.132 2.776 1.476 2.015 2.571 1.440 1.943 2.447 1.415 1.895 2.365 1.397 1.860 2.306 1.383 1.833 2.262 1.372 1.812 2.228 1.363 1.796 2.201 1.356 1.782 2.179 1.350 1.771 2.160 1.345 1.761 2.145 1.341 1.753 2.131 1.337 1.746 2.120 1.333 1.740 2.110 1.330 1.734 2.101 1.328 1.729 2.093 1.325 1.725 2.086 1.323 1.721 2.080 1.321 1.717 2.074 1.319 1.714 2.069 1.318 1.711 2.064 1.316 1.708 2.060 1.315 1.706 2.056 1.314 1.703 2.052 1.313 1.701 2.048 1.311 1.699 2.045 1.310 1.697 2.042 1.303 1.684 2.021 1.296 1.671 2.000 1.292 1.664 1.990 1.290 1.660 1.984 1.282 1.646 1.962 1.282 1.645 1.960 80% 90% 95% Confidence Level 63.66 318.31 636.62 9.925 22.327 31.599 5.841 10.215 12.924 4.604 7.173 8.610 4.032 5.893 6.869 3.707 5.208 5.959 3.499 4.785 5.408 3.355 4.501 5.041 3.250 4.297 4.781 3.169 4.144 4.587 3.106 4.025 4.437 3.055 3.930 4.318 3.012 3.852 4.221 2.977 3.787 4.140 2.947 3.733 4.073 2.921 3.686 4.015 2.898 3.646 3.965 2.878 3.610 3.922 2.861 3.579 3.883 2.845 3.552 3.850 2.831 3.527 3.819 2.819 3.505 3.792 2.807 3.485 3.768 2.797 3.467 3.745 2.787 3.450 3.725 2.779 3.435 3.707 2.771 3.421 3.690 2.763 3.408 3.674 2.756 3.396 3.659 2.750 3.385 3.646 2.704 3.307 3.551 2.660 3.232 3.460 2.639 3.195 3.416 2.626 3.174 3.390 2.581 3.098 3.300 2.576 3.090 3.291 99% 99.8% 99.9% 0.10% Monthly Vol Avg Mthly Rtn 3.87% 0.55% 5.47% 2.00% 3.365 3.143 2.998 2.896 2.821 2.764 2.718 2.681 2.650 2.624 2.602 2.583 2.567 2.552 2.539 2.528 2.518 2.508 2.500 2.492 2.485 2.479 2.473 2.467 2.462 2.457 2.423 2.390 2.374 2.364 2.330 2.326 98% 4.10% 0.30% 0.18%Step by Step Solution
There are 3 Steps involved in it
Step: 1

Get Instant Access to Expert-Tailored Solutions
See step-by-step solutions with expert insights and AI powered tools for academic success
Step: 2

Step: 3
Ace Your Homework with AI
Get the answers you need in no time with our AI-driven, step-by-step assistance
Get Started
Truth About Buying Annuities Annuities Can Make Or Break Your Retirement
Authors: Steve Weisman
1st Edition
0132353083,0132701162