Answered step by step
Verified Expert Solution
Link Copied!

Question

1 Approved Answer

Q: For the signal shown in fig. below: i) Classify the signal ii) Give a mathematical expression for the sketched signal f(t). iii) Find TFS
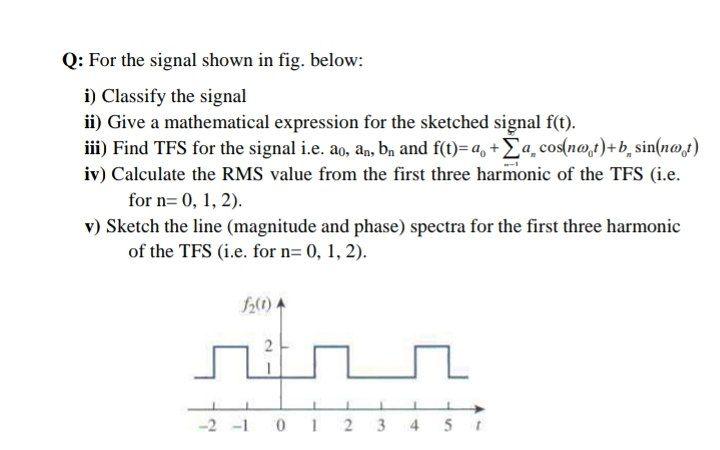
image text in transcribed

Q: For the signal shown in fig. below: i) Classify the signal ii) Give a mathematical expression for the sketched signal f(t). iii) Find TFS for the signal i.e. ao, an, b, and f(t)= a + 2a cos(n0,t)+bsin(n0,1) iv) Calculate the RMS value from the first three harmonic of the TFS (i.e. for n=0,1,2). v) Sketch the line (magnitude and phase) spectra for the first three harmonic of the TFS (i.e. for n= 0, 1, 2). 42(1) A rz -2 -1 0 1 2 34 St

Step by Step Solution

There are 3 Steps involved in it

Step: 1

blur-text-image

Get Instant Access to Expert-Tailored Solutions

See step-by-step solutions with expert insights and AI powered tools for academic success

Step: 2

blur-text-image_2

Step: 3

blur-text-image_3

Ace Your Homework with AI

Get the answers you need in no time with our AI-driven, step-by-step assistance

Get Started

Recommended Textbook for

Spatial Database Systems Design Implementation And Project Management

Authors: Albert K.W. Yeung, G. Brent Hall

1st Edition

1402053932, 978-1402053931

More Books

Students also viewed these Databases questions

Question

Discuss the difference between base pay and pay-for-performance.

Answered: 1 week ago