Answered step by step
Verified Expert Solution
Question
1 Approved Answer
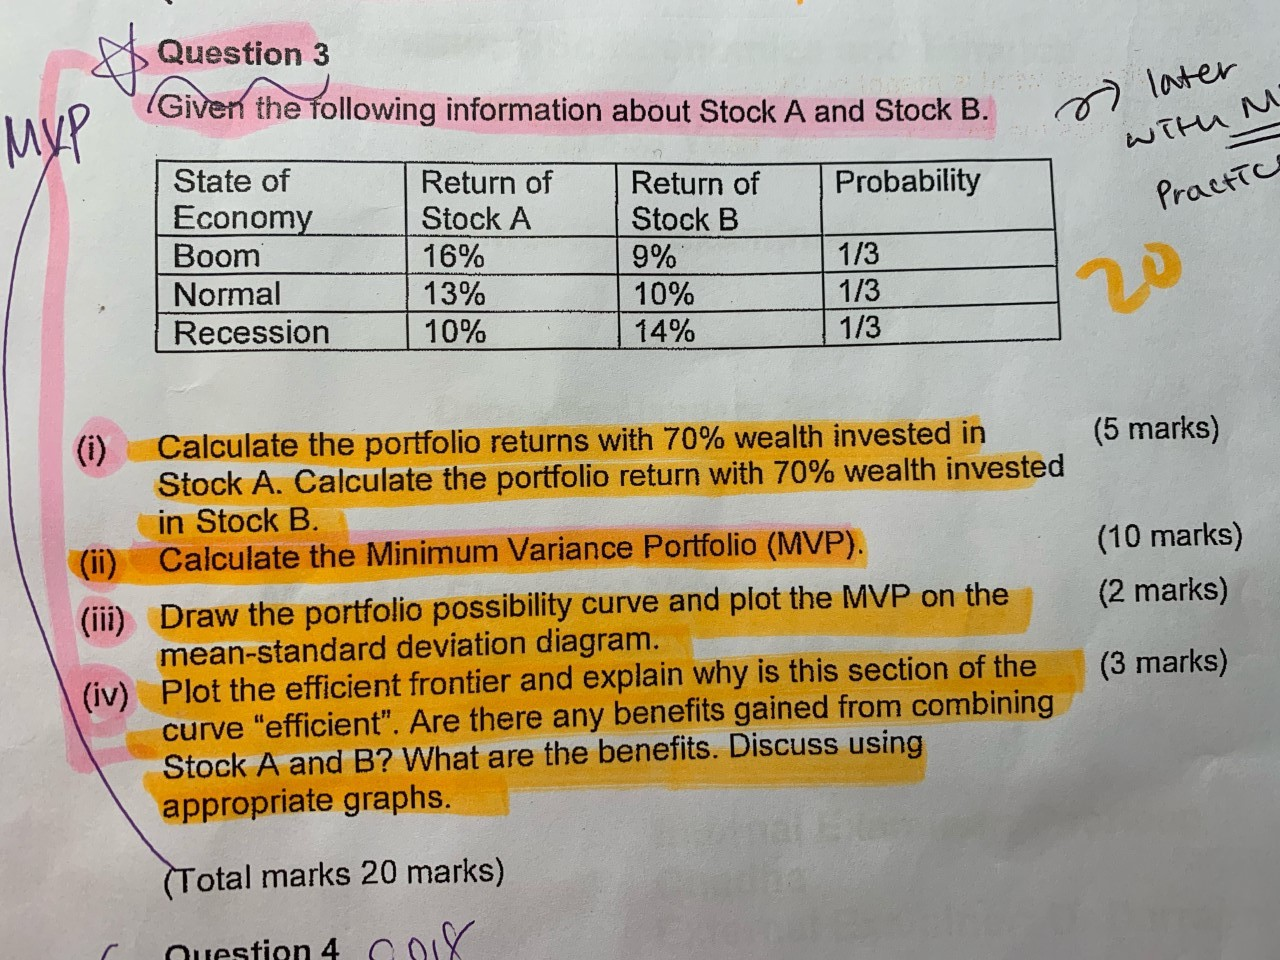
Q. given the following information about Stock A and Stock B. 1. Calculate the portfolio returns with 70% wealth invested in Stock A and Stock
 Q. given the following information about Stock A and Stock B.
1. Calculate the portfolio returns with 70% wealth invested in Stock A and Stock B.
2. Calculate the Minimum Variance Portfolio (MVP)
3.Draw the portfolio possibility curve and plot the MVP on the mean-standard deviation diagram.
4. Plot the efficient frontier and explain why is this section of the curve 'efficient'. Are there any benefits gained from combining Stock A and B? What are the benefits? Discuss using appropriate graphs.
Question 3 (Given the following information about Stock A and Stock B. MyP s later with M Practice Probability State of Economy Boom Normal Recession Return of Stock A 16% 13% 10% Return of Stock B 9% 10% 14% 1/3 1/3 1/3 (5 marks) (10 marks) (2 marks) (0) Calculate the portfolio returns with 70% wealth invested in Stock A. Calculate the portfolio return with 70% wealth invested in Stock B. (ii) Calculate the Minimum Variance Portfolio (MVP). (iii) Draw the portfolio possibility curve and plot the MVP on the mean-standard deviation diagram. (iv) Plot the efficient frontier and explain why is this section of the curve "efficient". Are there any benefits gained from combining Stock A and B? What are the benefits. Discuss using appropriate graphs. (3 marks) (Total marks 20 marks) nuestion 4 08Step by Step Solution
There are 3 Steps involved in it
Step: 1

Get Instant Access to Expert-Tailored Solutions
See step-by-step solutions with expert insights and AI powered tools for academic success
Step: 2

Step: 3

Ace Your Homework with AI
Get the answers you need in no time with our AI-driven, step-by-step assistance
Get Started


