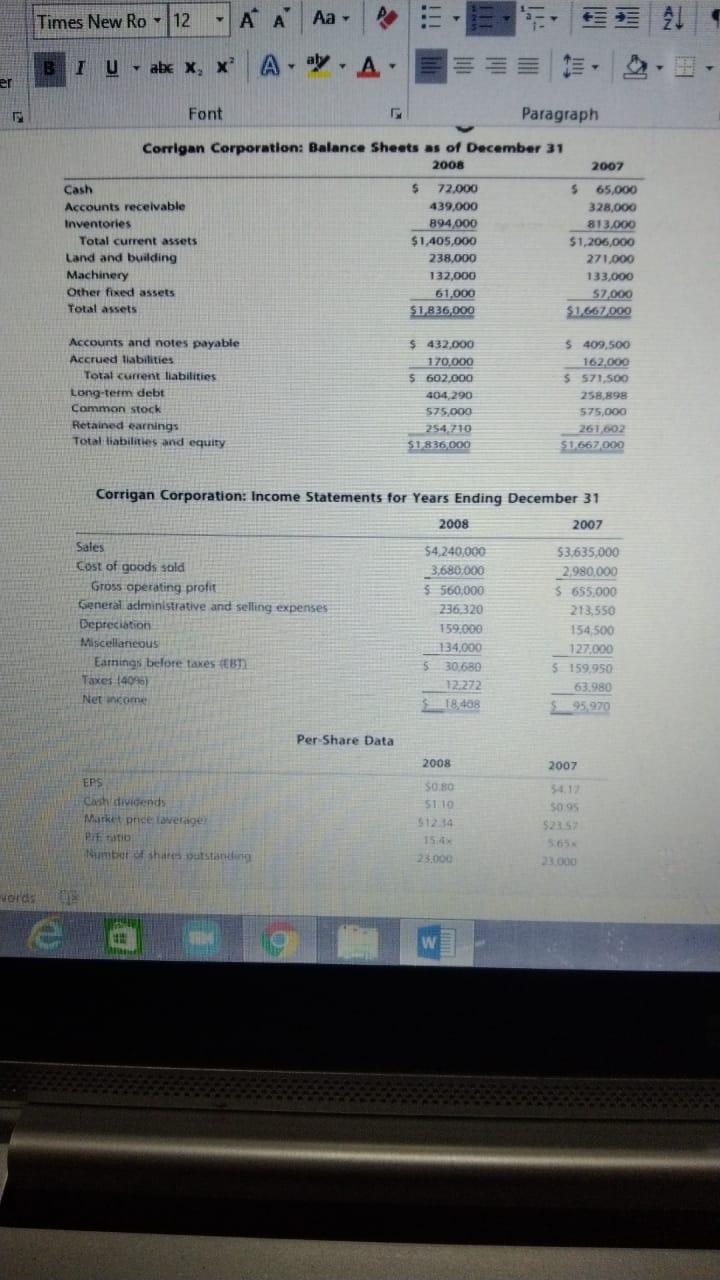
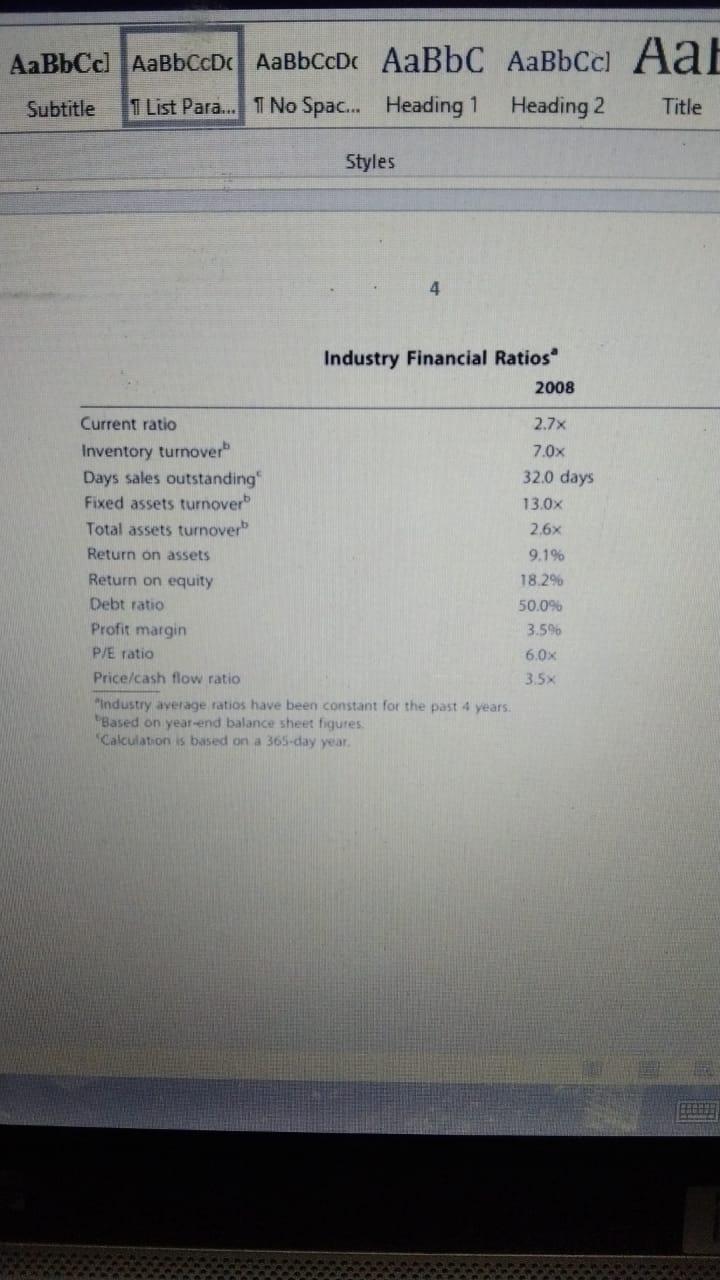
Q No 3: The Corrigan Corporations 2007 and 2008 financial statements follow, along with some industry average ratios. (10)
- Prepare horizontal analysis (in amount or %age) of Corrigan balance sheet data and briefly comment on the findings. (4)
- Assess any five ratios of Corrigans and determine how it compares with peers and how the position has changed over time. (4)
- What do you think would happen to its ratios if the company initiated cost-cutting measures that allowed it to hold lower levels of inventory and substantially decreased the cost of goods sold? No calculations are necessary. Think about which ratios would be affected by changes in these two accounts (2)
Times New Ro - 12 21 BI U abe x, x A. y . A.. er Font Paragraph Corrigan Corporation: Balance Sheets as of December 31 2008 2007 Cash $ 72.000 $ 65,000 Accounts receivable 439.000 328,000 Inventories 894,000 813.000 Total current assets $1,405,000 $1,206,000 Land and building 238.000 271.000 Machinery 132,000 133,000 Other fixed assets 61,000 S2000 Total assets $1,836,000 $1.667.000 Accounts and notes payable Accrued liabilities Total current liabilities Long-term debt Common stock Retained earnings Total liabilities and equity $ 432,000 170.000 5602,000 404 290 575.000 254.710 $1836,000 5 409,500 162.000 5571.500 258.898 575,000 261 002 $1.667.000 Corrigan Corporation: Income Statements for Years Ending December 31 2008 2007 Sales $4,240,000 53,635,000 Cost of goods sold 3,680,000 2.980.000 Gross operating profit $ 560,000 $ 655.000 General administrative and selling expenses 236 320 213,550 Depreciation 159.000 154,500 Miscellaneous 134,000 127.000 Earnings before taxes on S 30.680 $ 159,950 Taxes (4045) 12.272 63 980 Net nome 18,408 S95,970 Per-Share Data 2008 2007 EPS Cash dividends Market pnde average Pittato Number of shares outstanding SO BO 51:10 512 14 15 25.000 54.10 $0.99 5235 23.000 words w . 1 List Para... 1 No Spac. Heading 1 Heading 2 Subtitle Title Styles 4 Industry Financial Ratios 2008 Current ratio 2.7x Inventory turnover 7.0x Days sales outstanding 32.0 days Fixed assets turnover 13.0x Total assets turnover 2.6x Return on assets 9.1% Return on equity 18.296 Debt ratio 50.0% Profit margin 3.5% P/E ratio 6,0X Price/cash flow ratio 3.5% "Industry average ratios have been constant for the past 4 years. Based on year-end balance sheet figures Calculation is based on a 365-day year Times New Ro - 12 21 BI U abe x, x A. y . A.. er Font Paragraph Corrigan Corporation: Balance Sheets as of December 31 2008 2007 Cash $ 72.000 $ 65,000 Accounts receivable 439.000 328,000 Inventories 894,000 813.000 Total current assets $1,405,000 $1,206,000 Land and building 238.000 271.000 Machinery 132,000 133,000 Other fixed assets 61,000 S2000 Total assets $1,836,000 $1.667.000 Accounts and notes payable Accrued liabilities Total current liabilities Long-term debt Common stock Retained earnings Total liabilities and equity $ 432,000 170.000 5602,000 404 290 575.000 254.710 $1836,000 5 409,500 162.000 5571.500 258.898 575,000 261 002 $1.667.000 Corrigan Corporation: Income Statements for Years Ending December 31 2008 2007 Sales $4,240,000 53,635,000 Cost of goods sold 3,680,000 2.980.000 Gross operating profit $ 560,000 $ 655.000 General administrative and selling expenses 236 320 213,550 Depreciation 159.000 154,500 Miscellaneous 134,000 127.000 Earnings before taxes on S 30.680 $ 159,950 Taxes (4045) 12.272 63 980 Net nome 18,408 S95,970 Per-Share Data 2008 2007 EPS Cash dividends Market pnde average Pittato Number of shares outstanding SO BO 51:10 512 14 15 25.000 54.10 $0.99 5235 23.000 words w . 1 List Para... 1 No Spac. Heading 1 Heading 2 Subtitle Title Styles 4 Industry Financial Ratios 2008 Current ratio 2.7x Inventory turnover 7.0x Days sales outstanding 32.0 days Fixed assets turnover 13.0x Total assets turnover 2.6x Return on assets 9.1% Return on equity 18.296 Debt ratio 50.0% Profit margin 3.5% P/E ratio 6,0X Price/cash flow ratio 3.5% "Industry average ratios have been constant for the past 4 years. Based on year-end balance sheet figures Calculation is based on a 365-day year