Answered step by step
Verified Expert Solution
Question
1 Approved Answer
Q: Question QALMRI WORKSHEET 1. What is the diffuse, big picture research question? (one sentence) 2. What is the specific, small picture question addressed
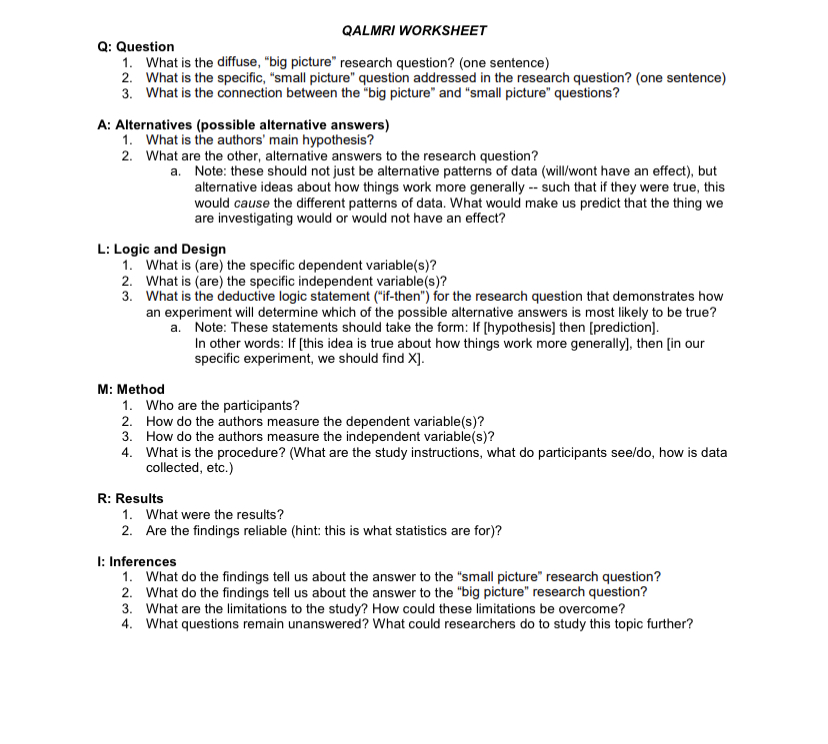
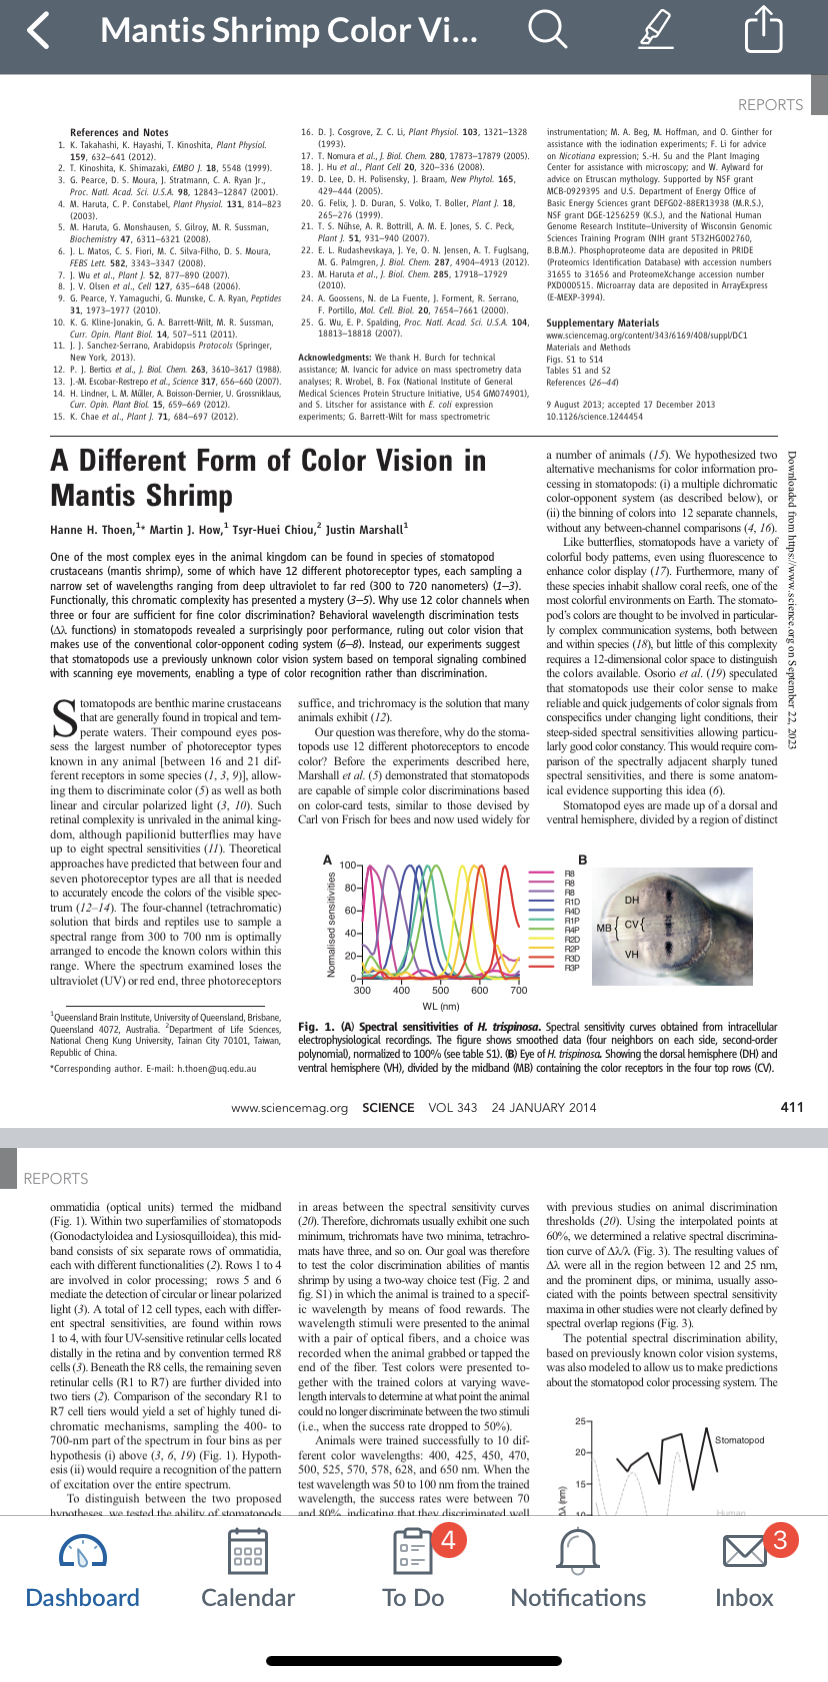
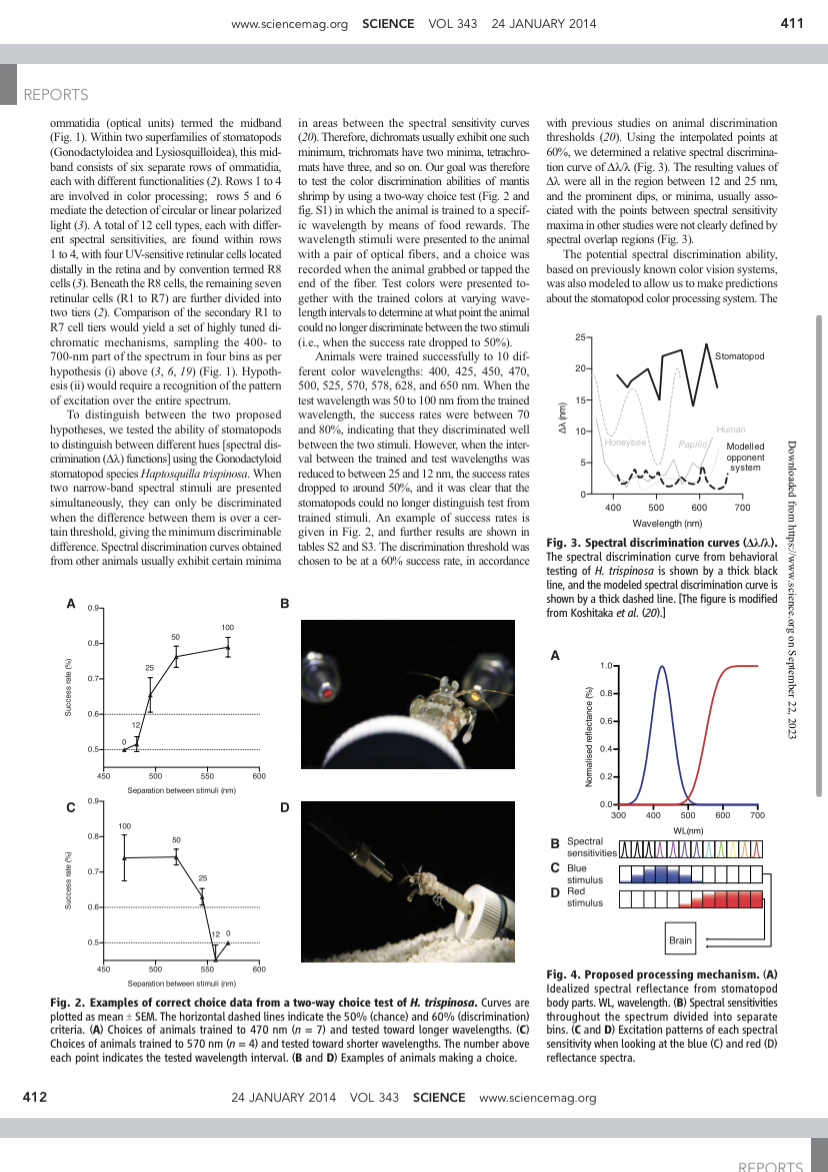
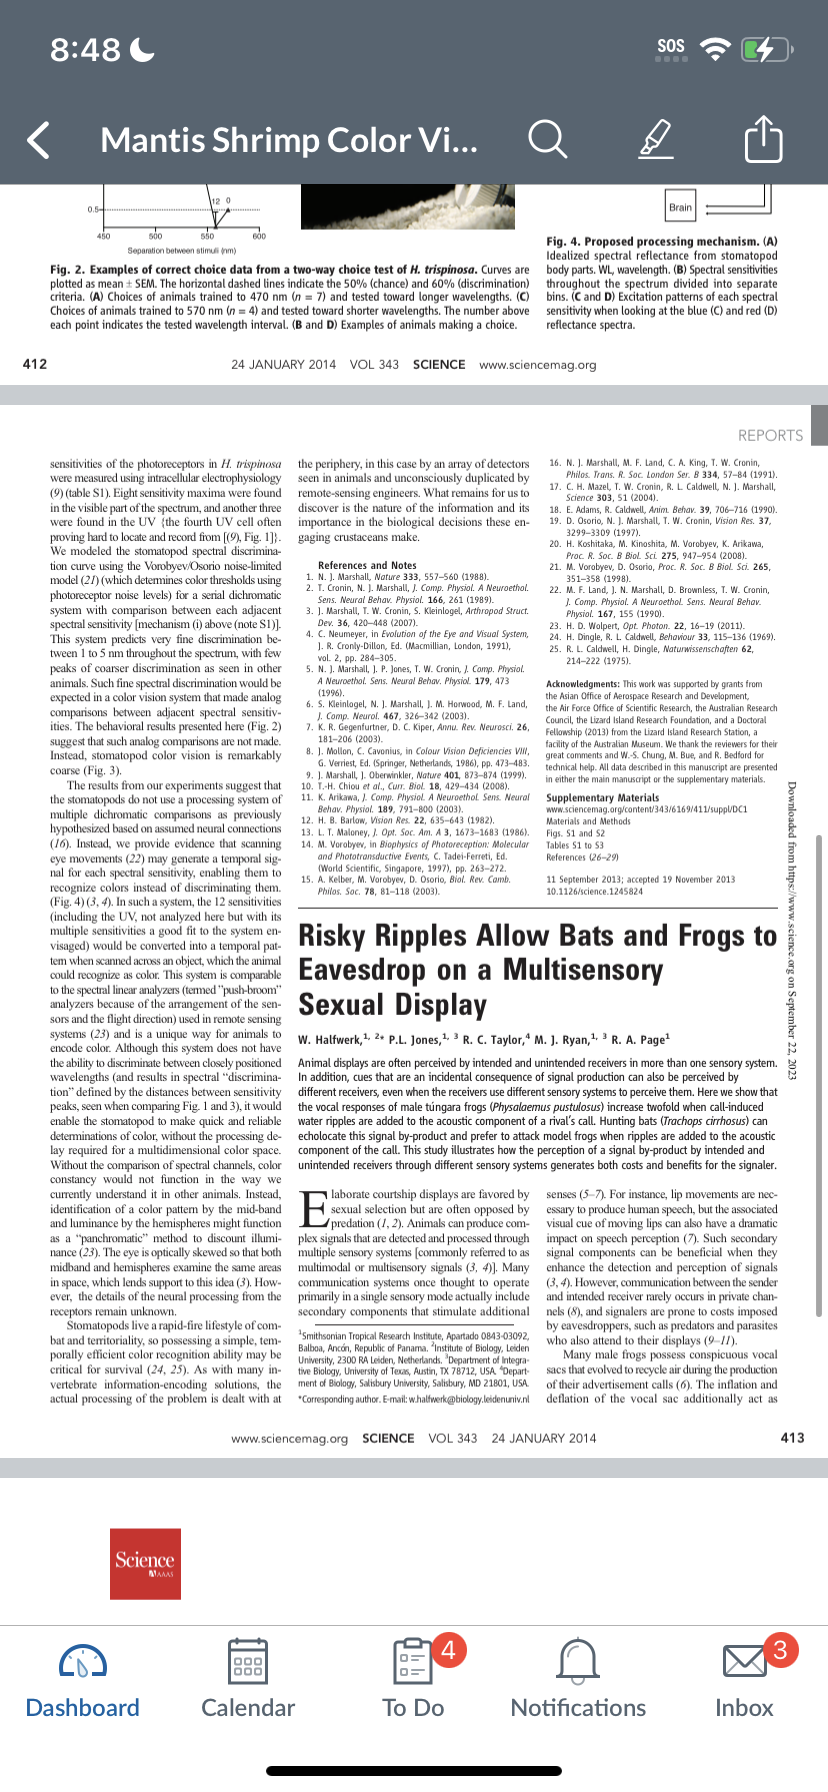
Q: Question QALMRI WORKSHEET 1. What is the diffuse, "big picture" research question? (one sentence) 2. What is the specific, "small picture" question addressed in the research question? (one sentence) 3. What is the connection between the "big picture" and "small picture" questions? A: Alternatives (possible alternative answers) 1. What is the authors' main hypothesis? 2. What are the other, alternative answers to the research question? a. Note: these should not just be alternative patterns of data (will/wont have an effect), but alternative ideas about how things work more generally -- such that if they were true, this would cause the different patterns of data. What would make us predict that the thing we are investigating would or would not have an effect? L: Logic and Design 1. What is (are) the specific dependent variable(s)? 2. What is (are) the specific independent variable(s)? 3. What is the deductive logic statement ("if-then") for the research question that demonstrates how an experiment will determine which of the possible alternative answers is most likely to be true? M: Method a. Note: These statements should take the form: If [hypothesis] then [prediction]. In other words: If [this idea is true about how things work more generally], then [in our specific experiment, we should find X]. 1. Who are the participants? 2. How do the authors measure the dependent variable(s)? 3. How do the authors measure the independent variable(s)? 4. What is the procedure? (What are the study instructions, what do participants see/do, how is data collected, etc.) R: Results 1. What were the results? 2. Are the findings reliable (hint: this is what statistics are for)? I: Inferences 1. What do the findings tell us about the answer to the "small picture" research question? 2. What do the findings tell us about the answer to the "big picture" research question? 3. What are the limitations to the study? How could these limitations be overcome? 4. What questions remain unanswered? What could researchers do to study this topic further? Mantis Shrimp Color Vi... Q References and Notes 1. K. Takahashi, K. Hayashi, T. Kinoshita, Plant Physiol. 159, 632-641 (2012). 2. T. Kinoshita, K. Shimazaki, EMBO J. 18, 5548 (1999). 3. G. Pearce, D. S. Moura, J. Stratmann, C. A. Ryan Jr., Proc. Natl. Acad. Sci. U.S.A. 98, 12843-12847 (2001). 4. M. Haruta, C. P. Constabel, Plant Physiol. 131, 814-823 (2003). 5. M. Haruta, G. Monshausen, S. Gilroy, M. R. Sussman, Biochemistry 47, 6311-6321 (2008). 6. J. L. Matos, C. S. Fiori, M. C. Silva-Filho, D. S. Moura, FEBS Lett. 582, 3343-3347 (2008). 7. J. Wu et al., Plant J. 52, 877-890 (2007). 8. J. V. Olsen et al., Cell 127, 635-648 (2006). 9. G. Pearce, Y. Yamaguchi, G. Munske, C. A. Ryan, Peptides 31, 1973-1977 (2010). 10. K. G. Kline-Jonakin, G. A. Barrett-Wilt, M. R. Sussman, Curr. Opin. Plant Biol. 14, 507-511 (2011). 11. J. J. Sanchez-Serrano, Arabidopsis Protocols (Springer, New York, 2013). 12. P. J. Bertics et al., J. Biol. Chem. 263, 3610-3617 (1988). 13. J.-M. Escobar-Restrepo et al., Science 317, 656-660 (2007). 14. H. Lindner, L. M. Mller, A. Boisson-Dernier, U. Grossniklaus Curr. Opin. Plant Biol. 15, 659-669 (2012). 15. K. Chae et al., Plant J. 71, 684-697 (2012). 16. D. J. Cosgrove, Z. C. Li, Plant Physiol. 103, 1321-1328 (1993). 17. T. Nomura et al., J. Biol. Chem. 280, 17873-17879 (2005). 18. J. Hu et al., Plant Cell 20, 320-336 (2008). 19. D. Lee, D. H. Polisensky, J. Braam, New Phytol. 165, 429-444 (2005). 20. G. Felix, J. D. Duran, S. Volko, T. Boller, Plant J. 18, 265-276 (1999). 21. T. S. Nhse, A. R. Bottrill, A. M. E. Jones, S. C. Peck, Plant J. 51, 931-940 (2007). 22. E. L. Rudashevskaya, J. Ye, O. N. Jensen, A. T. Fuglsang, M. G. Palmgren, J. Biol. Chem. 287, 4904-4913 (2012). 23. M. Haruta et al., J. Biol. Chem. 285, 17918-17929 (2010). 24. A. Goossens, N. de La Fuente, J. Forment, R. Serrano, F. Portillo, Mol. Cell. Biol. 20, 7654-7661 (2000). 25. G. Wu, E. P. Spalding, Proc. Natl. Acad. Sci. U.S.A. 104, 18813-18818 (2007). Acknowledgments: We thank H. Burch for technical assistance; M. Ivancic for advice on mass spectrometry data analyses; R. Wrobel, B. Fax (National Institute of General Medical Sciences Protein Structure Initiative, U54 GM074901), and S. Litscher for assistance with E. coli expression experiments; G. Barrett-Wilt for mass spectrometric A Different Form of Color Vision in Mantis Shrimp Hanne H. Thoen, Martin J. How, Tsyr-Huei Chiou, Justin Marshall One of the most complex eyes in the animal kingdom can be found in species of stomatopod crustaceans (mantis shrimp), some of which have 12 different photoreceptor types, each sampling a narrow set of wavelengths ranging from deep ultraviolet to far red (300 to 720 nanometers) (1-3). Functionally, this chromatic complexity has presented a mystery (3-5). Why use 12 color channels when three or four are sufficient for fine color discrimination? Behavioral wavelength discrimination tests (A functions) in stomatopods revealed a surprisingly poor performance, ruling out color vision that makes use of the conventional color-opponent coding system (6-8). Instead, our experiments suggest that stomatopods use a previously unknown color vision system based on temporal signaling combined with scanning eye movements, enabling a type of color recognition rather than discrimination. S tomatopods are benthic marine crustaceans that are generally found in tropical and tem- perate waters. Their compound eyes pos- sess the largest number of photoreceptor types known in any animal [between 16 and 21 dif- ferent receptors in some species (1, 3, 9)], allow ing them to discriminate color (5) as well as both linear and circular polarized light (3, 10). Such retinal complexity is unrivaled in the animal king- dom, although papilionid butterflies may have up to eight spectral sensitivities (II). Theoretical approaches have predicted that between four and seven photoreceptor types are all that is needed to accurately encode the colors of the visible spec- trum (12-14). The four-channel (tetrachromatic) solution that birds and reptiles use to sample a spectral range from 300 to 700 nm is optimally arranged to encode the known colors within this range. Where the spectrum examined loses the ultraviolet (UV) or red end, three photoreceptors Queensland Brain Institute, University of Queensland, Brisbane, Queensland 4072, Australia. Department of Life Sciences, National Cheng Kung University, Tainan City 70101, Taiwan, Republic of China. *Corresponding author. E-mail: h.thoen@uq.edu.au REPORTS instrumentation; M. A. Beg, M. Hoffman, and O. Ginther for assistance with the iodination experiments; F. Li for advice on Nicotiana expression; S.-H. Su and the Plant Imaging Center for assistance with microscopy; and W. Aylward for advice on Etruscan mythology. Supported by NSF grant MCB-0929395 and U.S. Department of Energy Office of Basic Energy Sciences grant DEFG02-88ER13938 (M.R.S.), NSF grant DGE-1256259 (K.S.), and the National Human Genome Research Institute-University of Wisconsin Genomic Sciences Training Program (NIH grant 5T32HG002760, B.B.M.). Phosphoproteome data are deposited in PRIDE (Proteomics Identification Database) with accession numbers 31655 to 31656 and ProteomeXchange accession number PXD000515. Microarray data are deposited in ArrayExpress (E-MEXP-3994). Supplementary Materials www.sciencemag.org/content/343/6169/408/suppl/DC1 Materials and Methods Figs. 51 to $14 Tables S1 and S2 References (26-44) 9 August 2013; accepted 17 December 2013 10.1126/science.1244454 a number of animals (15). We hypothesized two alternative mechanisms for color information pro- cessing in stomatopods: (i) a multiple dichromatic color-opponent system (as described below), or (ii) the binning of colors into 12 separate channels, without any between-channel comparisons (4, 16). Like butterflies, stomatopods have a variety of colorful body pattems, even using fluorescence to enhance color display (17). Furthermore, many of these species inhabit shallow coral reefs, one of the most colorful environments on Earth. The stomato- pod's colors are thought to be involved in particular- ly complex communication systems, both between and within species (18), but little of this complexity requires a 12-dimensional color space to distinguish the colors available. Osorio et al. (19) speculated that stomatopods use their color sense to make suffice, and trichromacy is the solution that many reliable and quick judgements of color signals from animals exhibit (12). Our question was therefore, why do the stoma- topods use 12 different photoreceptors to encode color? Before the experiments described here, Marshall et al. (5) demonstrated that stomatopods are capable of simple color discriminations based on color-card tests, similar to those devised by Carl von Frisch for bees and now used widely for A conspecifics under changing light conditions, their steep-sided spectral sensitivities allowing particu- larly good color constancy. This would require com- parison of the spectrally adjacent sharply tuned spectral sensitivities, and there is some anatom- ical evidence supporting this idea (6). Stomatopod eyes are made up of a dorsal and ventral hemisphere, divided by a region of distinct B RID F4D DH MB CV 100- 80- 60- R4P 40- R2D R2P 20- R3D R3P 0 300 400 500 600 WL (nm) 700 VH Fig. 1. (A) Spectral sensitivities of H. trispinosa. Spectral sensitivity curves obtained from intracellular electrophysiological recordings. The figure shows smoothed data (four neighbors on each side, second-order polynomial), normalized to 100% (see table S1). (B) Eye of H. trispinosa. Showing the dorsal hemisphere (DH) and ventral hemisphere (VH), divided by the midband (MB) containing the color receptors in the four top rows (CV). www.sciencemag.org SCIENCE VOL 343 24 JANUARY 2014 Downloaded from https://www.science.org on September 22, 2023 411 REPORTS ommatidia (optical units) termed the midband (Fig. 1). Within two superfamilies of stomatopods (Gonodactyloidea and Lysiosquilloidea), this mid- band consists of six separate rows of ommatidia, each with different functionalities (2). Rows 1 to 4 are involved in color processing; rows 5 and 6 mediate the detection of circular or linear polarized light (3). A total of 12 cell types, each with differ- ent spectral sensitivities, are found within rows 1 to 4, with four UV-sensitive retinular cells located distally in the retina and by convention termed R8 cells (3). Beneath the R8 cells, the remaining seven retinular cells (R1 to R7) are further divided into two tiers (2). Comparison of the secondary R1 to R7 cell tiers would yield a set of highly tuned di- chromatic mechanisms, sampling the 400- to 700-nm part of the spectrum in four bins as per hypothesis (i) above (3, 6, 19) (Fig. 1). Hypoth- esis (ii) would require a recognition of the pattern of excitation over the entire spectrum. To distinguish between the two proposed hunatheses we tested the ability of stomatonads in areas between the spectral sensitivity curves (20). Therefore, dichromats usually exhibit one such minimum, trichromats have two minima, tetrachro- mats have three, and so on. Our goal was therefore to test the color discrimination abilities of mantis shrimp by using a two-way choice test (Fig. 2 and fig. S1) in which the animal is trained to a specif- ic wavelength by means of food rewards. The wavelength stimuli were presented to the animal with a pair of optical fibers, and a choice was recorded when the animal grabbed or tapped the end of the fiber. Test colors were presented to- gether with the trained colors at varying wave- length intervals to determine at what point the animal could no longer discriminate between the two stimuli (i.e., when the success rate dropped to 50%). Animals were trained successfully to 10 dif- ferent color wavelengths: 400, 425, 450, 470, 500, 525, 570, 578, 628, and 650 nm. When the test wavelength was 50 to 100 nm from the trained wavelength, the success rates were between 70 and 80% indicating that they discriminated well 4 with previous studies on animal discrimination thresholds (20). Using the interpolated points at 60%, we determined a relative spectral discrimina- tion curve of AX (Fig. 3). The resulting values of A were all in the region between 12 and 25 nm, and the prominent dips, or minima, usually asso- ciated with the points between spectral sensitivity maxima in other studies were not clearly defined by spectral overlap regions (Fig. 3). The potential spectral discrimination ability, based on previously known color vision systems, was also modeled to allow us to make predictions about the stomatopod color processing system. The 25- 20- 15- Stomatopod ww 3 Dashboard Calendar To Do Notifications Inbox www.sciencemag.org SCIENCE VOL 343 24 JANUARY 2014 411 REPORTS ommatidia (optical units) termed the midband (Fig. 1). Within two superfamilies of stomatopods (Gonodactyloidea and Lysiosquilloidea), this mid- band consists of six separate rows of ommatidia, each with different functionalities (2). Rows 1 to 4 are involved in color processing; rows 5 and 6 mediate the detection of circular or linear polarized light (3). A total of 12 cell types, each with differ- ent spectral sensitivities, are found within rows 1 to 4, with four UV-sensitive retinular cells located distally in the retina and by convention termed R8 cells (3). Beneath the R8 cells, the remaining seven retinular cells (R1 to R7) are further divided into two tiers (2). Comparison of the secondary R1 to R7 cell tiers would yield a set of highly tuned di- chromatic mechanisms, sampling the 400- to 700-nm part of the spectrum in four bins as per hypothesis (i) above (3, 6, 19) (Fig. 1). Hypoth- esis (ii) would require a recognition of the pattern of excitation over the entire spectrum. To distinguish between the two proposed hypotheses, we tested the ability of stomatopods to distinguish between different hues [spectral dis- crimination (AX) functions] using the Gonodactyloid stomatopod species Haptosquilla trispinosa. When two narrow-band spectral stimuli are presented simultaneously, they can only be discriminated when the difference between them is over a cer- tain threshold, giving the minimum discriminable difference. Spectral discrimination curves obtained from other animals usually exhibit certain minima A 0.9 B in areas between the spectral sensitivity curves (20). Therefore, dichromats usually exhibit one such minimum, trichromats have two minima, tetrachro- mats have three, and so on. Our goal was therefore to test the color discrimination abilities of mantis shrimp by using a two-way choice test (Fig. 2 and fig. S1) in which the animal is trained to a specif- ic wavelength by means of food rewards. The wavelength stimuli were presented to the animal with a pair of optical fibers, and a choice was recorded when the animal grabbed or tapped the end of the fiber. Test colors were presented to- gether with the trained colors at varying wave length intervals to determine at what point the animal could no longer discriminate between the two stimuli (i.e., when the success rate dropped to 50%). Animals were trained successfully to 10 dif- ferent color wavelengths: 400, 425, 450, 470, 500, 525, 570, 578, 628, and 650 nm. When the test wavelength was 50 to 100 nm from the trained wavelength, the success rates were between 70 and 80%, indicating that they discriminated well between the two stimuli. However, when the inter- val between the trained and test wavelengths was reduced to between 25 and 12 nm, the success rates dropped to around 50%, and it was clear that the stomatopods could no longer distinguish test from trained stimuli. An example of success rates is given in Fig. 2, and further results are shown in tables S2 and S3. The discrimination threshold was chosen to be at a 60% success rate, in accordance with previous studies on animal discrimination thresholds (20). Using the interpolated points at 60%, we determined a relative spectral discrimina- tion curve of AX (Fig. 3). The resulting values of A were all in the region between 12 and 25 nm, and the prominent dips, or minima, usually asso- ciated with the points between spectral sensitivity maxima in other studies were not clearly defined by spectral overlap regions (Fig. 3). The potential spectral discrimination ability, based on previously known color vision systems, was also modeled to allow us to make predictions about the stomatopod color processing system. The 25- 20- 15- 10- 5- Stomatopod Human Honeybee Papilio Modelled opponent system 400 500 600 Wavelength (nm) 700 Fig. 3. Spectral discrimination curves (A/). The spectral discrimination curve from behavioral testing of H. trispinosa is shown by a thick black line, and the modeled spectral discrimination curve is shown by a thick dashed line. [The figure is modified from Koshitaka et al. (20).] 0.8- 0.7- 0.6- 12 0.5- 0.9 C 450 25 100 50 550 500 Separation between stimuli (nm) 100 0.8- 50 600 D A 1.0- 0.8- 0.6- 0.4- 0.2- 0.0+ 300 400 500 600 700 WL(nm) B Spectral w.science.org on September 22, 2023 0.7- 0.6- 0.5- 450 500 550 12 0 Separation between stimuli (nm) 600 Fig. 2. Examples of correct choice data from a two-way choice test of H. trispinosa. Curves are plotted as mean SEM. The horizontal dashed lines indicate the 50% (chance) and 60% (discrimination) criteria. (A) Choices of animals trained to 470 nm (n = 7) and tested toward longer wavelengths. (C) Choices of animals trained to 570 nm (n = 4) and tested toward shorter wavelengths. The number above each point indicates the tested wavelength interval. (B and D) Examples of animals making a choice. sensitivities AAA C Blue stimulus D Red stimulus Brain Fig. 4. Proposed processing mechanism. (A) Idealized spectral reflectance from stomatopod body parts. WL, wavelength. (B) Spectral sensitivities throughout the spectrum divided into separate bins. (C and D) Excitation patterns of each spectral sensitivity when looking at the blue (C) and red (D) reflectance spectra. 24 JANUARY 2014 VOL 343 SCIENCE www.sciencemag.org 412 REPORTS 8:48 < Mantis Shrimp Color Vi... 412 SOS 450 500 550 12 0 Separation between stimuli (nm) 600 Fig. 2. Examples of correct choice data from a two-way choice test of H. trispinosa. Curves are plotted as mean SEM. The horizontal dashed lines indicate the 50% (chance) and 60% (discrimination) criteria. (A) Choices of animals trained to 470 nm (n = 7) and tested toward longer wavelengths. (C) Choices of animals trained to 570 nm (n = 4) and tested toward shorter wavelengths. The number above each point indicates the tested wavelength interval. (B and D) Examples of animals making a choice. Brain Fig. 4. Proposed processing mechanism. (A) Idealized spectral reflectance from stomatopod body parts. WL, wavelength. (B) Spectral sensitivities throughout the spectrum divided into separate bins. (C and D) Excitation patterns of each spectral sensitivity when looking at the blue (C) and red (D) reflectance spectra. 24 JANUARY 2014 VOL 343 SCIENCE www.sciencemag.org sensitivities of the photoreceptors in H. trispinosa were measured using intracellular electrophysiology (9) (table S1). Eight sensitivity maxima were found in the visible part of the spectrum, and another three were found in the UV (the fourth UV cell often proving hard to locate and record from [(9), Fig. 1]}. We modeled the stomatopod spectral discrimina- tion curve using the Vorobyev/Osorio noise-limited model (21) (which determines color thresholds using photoreceptor noise levels) for a serial dichromatic system with comparison between each adjacent spectral sensitivity [mechanism (i) above (note S1)]. This system predicts very fine discrimination be- tween 1 to 5 nm throughout the spectrum, with few peaks of coarser discrimination as seen in other animals. Such fine spectral discrimination would be expected in a color vision system that made analog comparisons between adjacent spectral sensitiv- ities. The behavioral results presented here (Fig. 2) suggest that such analog comparisons are not made. Instead, stomatopod color vision is remarkably coarse (Fig. 3). The results from our experiments suggest that the stomatopods do not use a processing system of multiple dichromatic comparisons as previously hypothesized based on assumed neural connections (16). Instead, we provide evidence that scanning eye movements (22) may generate a temporal sig- nal for each spectral sensitivity, enabling them to recognize colors instead of discriminating them. (Fig. 4) (3, 4). In such a system, the 12 sensitivities (including the UV, not analyzed here but with its multiple sensitivities a good fit to the system en- visaged) would be converted into a temporal pat- tem when scanned across an object, which the animal the periphery, in this case by an array of detectors seen in animals and unconsciously duplicated by remote-sensing engineers. What remains for us to discover is the nature of the information and its importance in the biological decisions these en- gaging crustaceans make. References and Notes 1. N. J. Marshall, Nature 333, 557-560 (1988). 2. T. Cronin, N. J. Marshall, J. Comp. Physiol. A Neuroethol. Sens. Neural Behav. Physiol. 166, 261 (1989). 3. J. Marshall, T. W. Cronin, S. Kleinlogel, Arthropod Struct. Dev. 36, 420-448 (2007). 4. C. Neumeyer, in Evolution of the Eye and Visual System, J. R. Cronly-Dillon, Ed. (Macmillian, London, 1991), vol. 2, pp. 284-305. 5. N. J. Marshall, J. P. Jones, T. W. Cronin, J. Comp. Physiol. A Neuroethol. Sens. Neural Behav. Physiol. 179, 473 (1996). 6. S. Kleinlogel, N. J. Marshall, J. M. Horwood, M. F. Land, J. Comp. Neurol. 467, 326-342 (2003). 7. K. R. Gegenfurtner, D. C. Kiper, Annu. Rev. Neurosci. 26, 181-206 (2003). 8. J. Mollon, C. Cavonius, in Colour Vision Deficiencies VIII, G. Verriest, Ed. (Springer, Netherlands, 1986), pp. 473483. 9. J. Marshall, J. Oberwinkler, Nature 401, 873-874 (1999). 10. T.-H. Chiou et al., Curr. Biol. 18, 429-434 (2008). 11. K. Arikawa, J. Comp. Physiol. A Neuroethol. Sens. Neural Behav. Physiol. 189, 791-800 (2003). 12. H. B. Barlow, Vision Res. 22, 635-643 (1982). 13. L. T. Maloney, J. Opt. Soc. Am. A 3, 1673-1683 (1986). 14. M. Vorobyev, in Biophysics of Photoreception: Molecular and Phototransductive Events, C. Tadei-Ferreti, Ed. (World Scientific, Singapore, 1997), pp. 263-272. 15. A. Kelber, M. Vorobyev, D. Osorio, Biol. Rev. Camb. Philos. Soc. 78, 81-118 (2003). REPORTS 16. N. J. Marshall, M. F. Land, C. A. King, T. W. Cronin, Philos. Trans. R. Soc. London Ser. B 334, 57-84 (1991). 17. C. H. Mazel, T. W. Cronin, R. L. Caldwell, N. J. Marshall, Science 303, 51 (2004). 18. E. Adams, R. Caldwell, Anim. Behav. 39, 706-716 (1990). 19. D. Osorio, N. J. Marshall, T. W. Cronin, Vision Res. 37, 3299-3309 (1997). 20. H. Koshitaka, M. Kinoshita, M. Vorobyev, K. Arikawa, Proc. R. Soc. B Biol Sci 275, 947-954 (2008). 21. M. Vorobyev, D. Osorio, Proc. R. Soc. B Biol. Sci. 265, 351-358 (1998). 22. M. F. Land, J. N. Marshall, D. Brownless, T. W. Cronin, J. Comp. Physiol. A Neuroethol. Sens. Neural Behav. Physiol. 167, 155 (1990). 23. H. D. Wolpert, Opt. Photon. 22, 16-19 (2011). 24. H. Dingle, R. L. Caldwell, Behaviour 33, 115136 (1969). 25. R. L. Caldwell, H. Dingle, Naturwissenschaften 62, 214-222 (1975). Acknowledgments: This work was supported by grants from the Asian Office of Aerospace Research and Development, the Air Force Office of Scientific Research, the Australian Research Council, the Lizard Island Research Foundation, and a Doctoral Fellowship (2013) from the Lizard Island Research Station, a facility of the Australian Museum. We thank the reviewers for their great comments and W.-S. Chung, M. Bue, and R. Bedford for technical help. All data described in this manuscript are presented in either the main manuscript or the supplementary materials. Supplementary Materials www.sciencemag.org/content/343/6169/411/suppl/DC1 Materials and Methods Figs. S1 and S2 Tables $1 to $3 References (26-29) 11 September 2013; accepted 19 November 2013 10.1126/science.1245824 Risky Ripples Allow Bats and Frogs to could recognize as color. This system is comparable Eavesdrop on a Multisensory to the spectral linear analyzers (termed "push-broom" analyzers because of the arrangement of the sen- sors and the flight direction) used in remote sensing systems (23) and is a unique way for animals to encode color. Although this system does not have the ability to discriminate between closely positioned wavelengths (and results in spectral "discrimina- tion" defined by the distances between sensitivity peaks, seen when comparing Fig. 1 and 3), it would enable the stomatopod to make quick and reliable determinations of color, without the processing de- lay required for a multidimensional color space. Without the comparison of spectral channels, color constancy would not function in the way we currently understand it in other animals. Instead, identification of a color pattern by the mid-band and luminance by the hemispheres might function as a "panchromatic" method to discount illumi- nance (23). The eye is optically skewed so that both midband and hemispheres examine the same areas in space, which lends support to this idea (3). How ever, the details of the neural processing from the receptors remain unknown. Stomatopods live a rapid-fire lifestyle of com- bat and territoriality, so possessing a simple, tem- porally efficient color recognition ability may be critical for survival (24, 25). As with many in- vertebrate information-encoding solutions, the actual processing of the problem is dealt with at Sexual Display W. Halfwerk,, 2* P.L. Jones,. 3 R. C. Taylor, M. J. Ryan, 1, 3 R. A. Page Animal displays are often perceived by intended and unintended receivers in more than one sensory system. In addition, cues that are an incidental consequence of signal production can also be perceived by different receivers, even when the receivers use different sensory systems to perceive them. Here we show that the vocal responses of male tngara frogs (Physalaemus pustulosus) increase twofold when call-induced water ripples are added to the acoustic component of a rival's call. Hunting bats (Trachops cirrhosus) can echolocate this signal by-product and prefer to attack model frogs when ripples are added to the acoustic component of the call. This study illustrates how the perception of a signal by-product by intended and unintended receivers through different sensory systems generates both costs and benefits for the signaler. laborate courtship displays are favored by sexual selection but are often opposed by plex signals that are detected and processed through multiple sensory systems [commonly referred to as multimodal or multisensory signals (3, 4)]. Many communication systems once thought to operate primarily in a single sensory mode actually include secondary components that stimulate additional Smithsonian Tropical Research Institute, Apartado 0843-03092, Balboa, Ancn, Republic of Panama. "Institute of Biology, Leiden University, 2300 RA Leiden, Netherlands. "Department of Integra- tive Biology, University of Texas, Austin, TX 78712, USA. "Depart ment of Biology, Salisbury University, Salisbury, MD 21801, USA. *Corresponding author. E-mail: w.halfwerk@biology.leidenuniv.nl senses (5-7). For instance, lip movements are nec- essary to produce human speech, but the associated visual cue of moving lips can also have a dramatic impact on speech perception (7). Such secondary signal components can be beneficial when they enhance the detection and perception of signals (3, 4). However, communication between the sender and intended receiver rarely occurs in private chan nels (8), and signalers are prone to costs imposed by eavesdroppers, such as predators and parasites who also attend to their displays (9-11). Many male frogs possess conspicuous vocal sacs that evolved to recycle air during the production of their advertisement calls (6). The inflation and deflation of the vocal sac additionally act as www.sciencemag.org SCIENCE VOL 343 24 JANUARY 2014 Downloaded from https://www.science.org on September 22, 2023 413 Science MAMAS 4 3 DOO Dashboard Calendar To Do Notifications Inbox
Step by Step Solution
There are 3 Steps involved in it
Step: 1

Get Instant Access to Expert-Tailored Solutions
See step-by-step solutions with expert insights and AI powered tools for academic success
Step: 2

Step: 3

Ace Your Homework with AI
Get the answers you need in no time with our AI-driven, step-by-step assistance
Get Started


