Answered step by step
Verified Expert Solution
Link Copied!

Question

1 Approved Answer

Q. What are the sneaker 2013 and persistence's initial investment? Q. What are the sneaker 2013 and persistence's payback period? The sneaker 2013 Persistence 2012
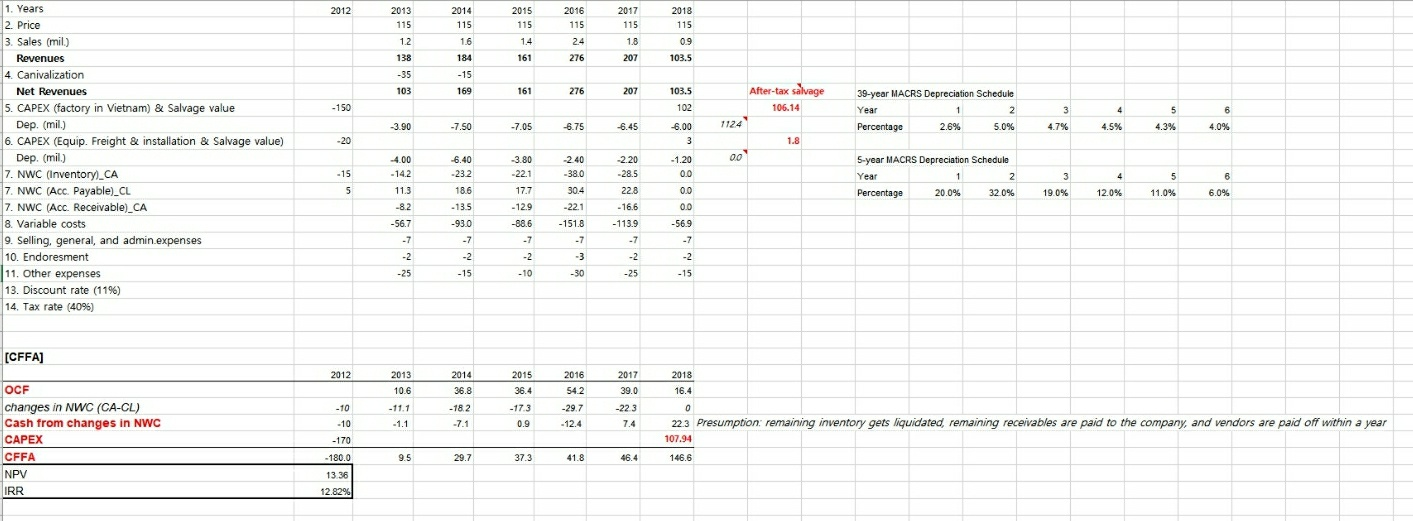
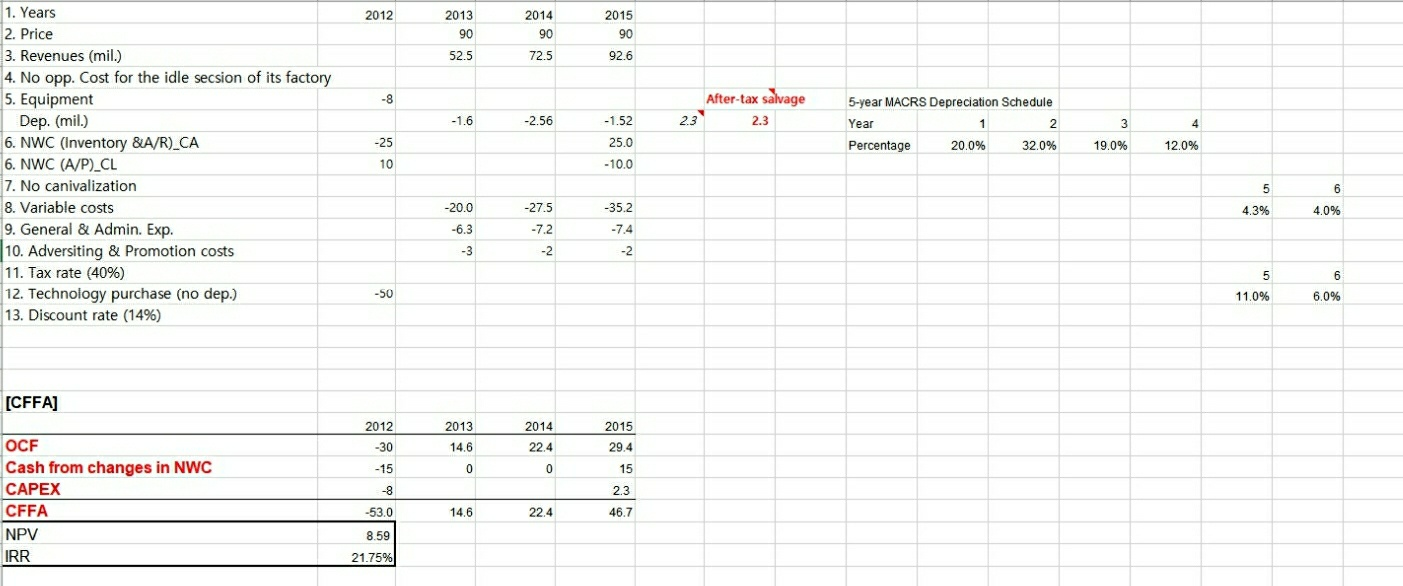
Q. What are the sneaker 2013 and persistence's initial investment?

Q. What are the sneaker 2013 and persistence's payback period?

The sneaker 2013

image text in transcribed

Persistence

image text in transcribed

2012 2015 2013 115 2014 115 2016 115 2018 115 115 2017 115 1.8 207 1.2 1.4 1.6 184 2.4 276 0.9 103.5 138 161 -35 -15 103 169 161 276 207 103.5 After-tax salvage 106.14 - 150 102 39-year MACRS Depreciation Schedule Year 1 2 Percentage 2.6% 5.0% 4 6 3 4.7% 5 4.3% -3.90 -7.50 -7.05 -6.75 1124 -6.45 4.5% 4.0% -6.00 3 1.8 1. Years 2. Price 3. Sales (mil.) Revenues 4. Canivalization Net Revenues 5. CAPEX (factory in Vietnam) & Salvage value Dep. (mil.) 6. CAPEX (Equip. Freight & installation & Salvage value) Dep. (mil.) 7. NWC (Inventory) CA 7. NWC (Acc. Payable).CL 7. NWC (Acc. Receivable) CA 8. Variable costs 9. Selling, general, and admin.expenses 10. Endoresment 11. Other expenses 13. Discount rate (1196) 14. Tax rate (40%) 00 -4.00 -142 -6.40 -232 3.80 -22.1 -240 -38.0 304 -15 - 1.20 0.0 -2.20 -28.5 22.8 5-year MACRS Depreciation Schedule Year 1 2 Percentage 20.0% 320% 4 3 19.0% B 6.0% 5 18.6 17.7 12.0% 11.0% 11.3 -8.2 - 12.9 -22.1 - 13.5 -93.0 - 16.6 -113.9 0.0 0.0 -569 -7 -56.7 30. -7 -2 -25 -7 -151.8 -7 -3 -7 -2 -15 -88.6 -7 -2 - 10 -2 -2 -15 -30 -25 (CFFA] 2012 2013 2014 36.8 2015 36.4 2016 54.2 2017 39.0 2018 16.4 10.6 0 -10 -10 -170 -11.1 -1.1 -182 -7.1 -17.3 0.9 -29.7 -12.4 -223 7.4 OCF changes in NWC (CA-CL) Cash from changes in NWC CAPEX CFFA NPV IRR 22.3 Presumption: remaining inventory gets liquidated, remaining receivables are paid to the company, and vendors are paid off within a year 107.94 -180.0 9.5 29.7 37.3 41.8 46.4 146.6 13.36 12.82% 2012 2014 2013 90 2015 90 90 52.5 72.5 92.6 -8 After-tax salvage 23 2.3 -1.6 -2.56 5-year MACRS Depreciation Schedule Year 2 Percentage 20.0% 32.0% 3 4 -25 -1.52 25.0 -10.0 19.0% 1. Years 2. Price 3. Revenues (mil.) 4. No opp. Cost for the idle secsion of its factory 5. Equipment Dep. (mil.) 6. NWC (Inventory &A/R)_CA 6. NWC (A/P) CL 7. No canivalization 8. Variable costs 9. General & Admin. Exp. 10. Adversiting & Promotion costs 11. Tax rate (40%) 12. Technology purchase (no dep.) 13. Discount rate (14%) 12.0% 10 5 6 -20.0 -35.2 4.3% 4.0% -27.5 -7.2 -6.3 -7.4 -3 -2 -2 5 6 -50 11.0% 6.0% [CFFA] 2012 -30 2013 14.6 0 2014 22.4 2015 29.4 -15 0 -8 OCF Cash from changes in NWC CAPEX CFFA NPV IRR 15 2.3 46.7 -53.0 14.6 22.4 8.59 21.75%

Step by Step Solution

There are 3 Steps involved in it

Step: 1

blur-text-image

Get Instant Access to Expert-Tailored Solutions

See step-by-step solutions with expert insights and AI powered tools for academic success

Step: 2

blur-text-image_2

Step: 3

blur-text-image_3

Ace Your Homework with AI

Get the answers you need in no time with our AI-driven, step-by-step assistance

Get Started

Recommended Textbook for

Public Finance Theory And Practice

Authors: M. Marlow

1st Edition

0030969603, 978-0030969607

More Books

Students also viewed these Finance questions