Answered step by step
Verified Expert Solution
Link Copied!

Question

1 Approved Answer

Q#04: From given data perform Horizontal analysis for all three years as base? 10 marks For the Years Ended December 31, 2011 2010 2009 $100,000
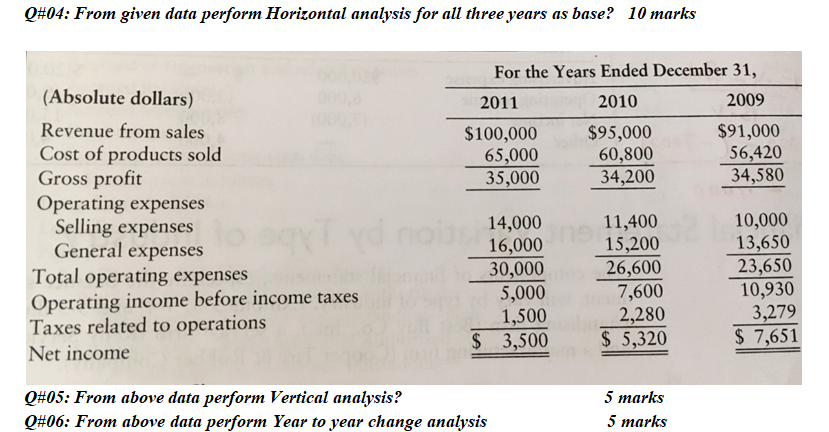
image text in transcribed

Q#04: From given data perform Horizontal analysis for all three years as base? 10 marks For the Years Ended December 31, 2011 2010 2009 $100,000 $95,000 $91,000 65,000 60,800 56,420 35,000 34,200 34,580 (Absolute dollars) Revenue from sales Cost of products sold Gross profit Operating expenses Selling expenses General expenses Total operating expenses Operating income before income taxes Taxes related to operations Net income 14,000 16,000 30,000 5,000 1,500 $ 3,500 11,400 15,200 26,600 7,600 2,280 10,000 13,650 23,650 10,930 3,279 $ 7,651 $ 5,320 Q#05: From above data perform Vertical analysis? Q#06: From above data perform Year to year change analysis 5 marks 5 marks

Step by Step Solution

There are 3 Steps involved in it

Step: 1

blur-text-image

Get Instant Access to Expert-Tailored Solutions

See step-by-step solutions with expert insights and AI powered tools for academic success

Step: 2

blur-text-image

Step: 3

blur-text-image

Ace Your Homework with AI

Get the answers you need in no time with our AI-driven, step-by-step assistance

Get Started

Recommended Textbook for

Foundations of Finance The Logic and Practice of Financial Management

Authors: Arthur J. Keown, John D. Martin, J. William Petty

8th edition

132994879, 978-0132994873

More Books

Students also viewed these Finance questions