

Question
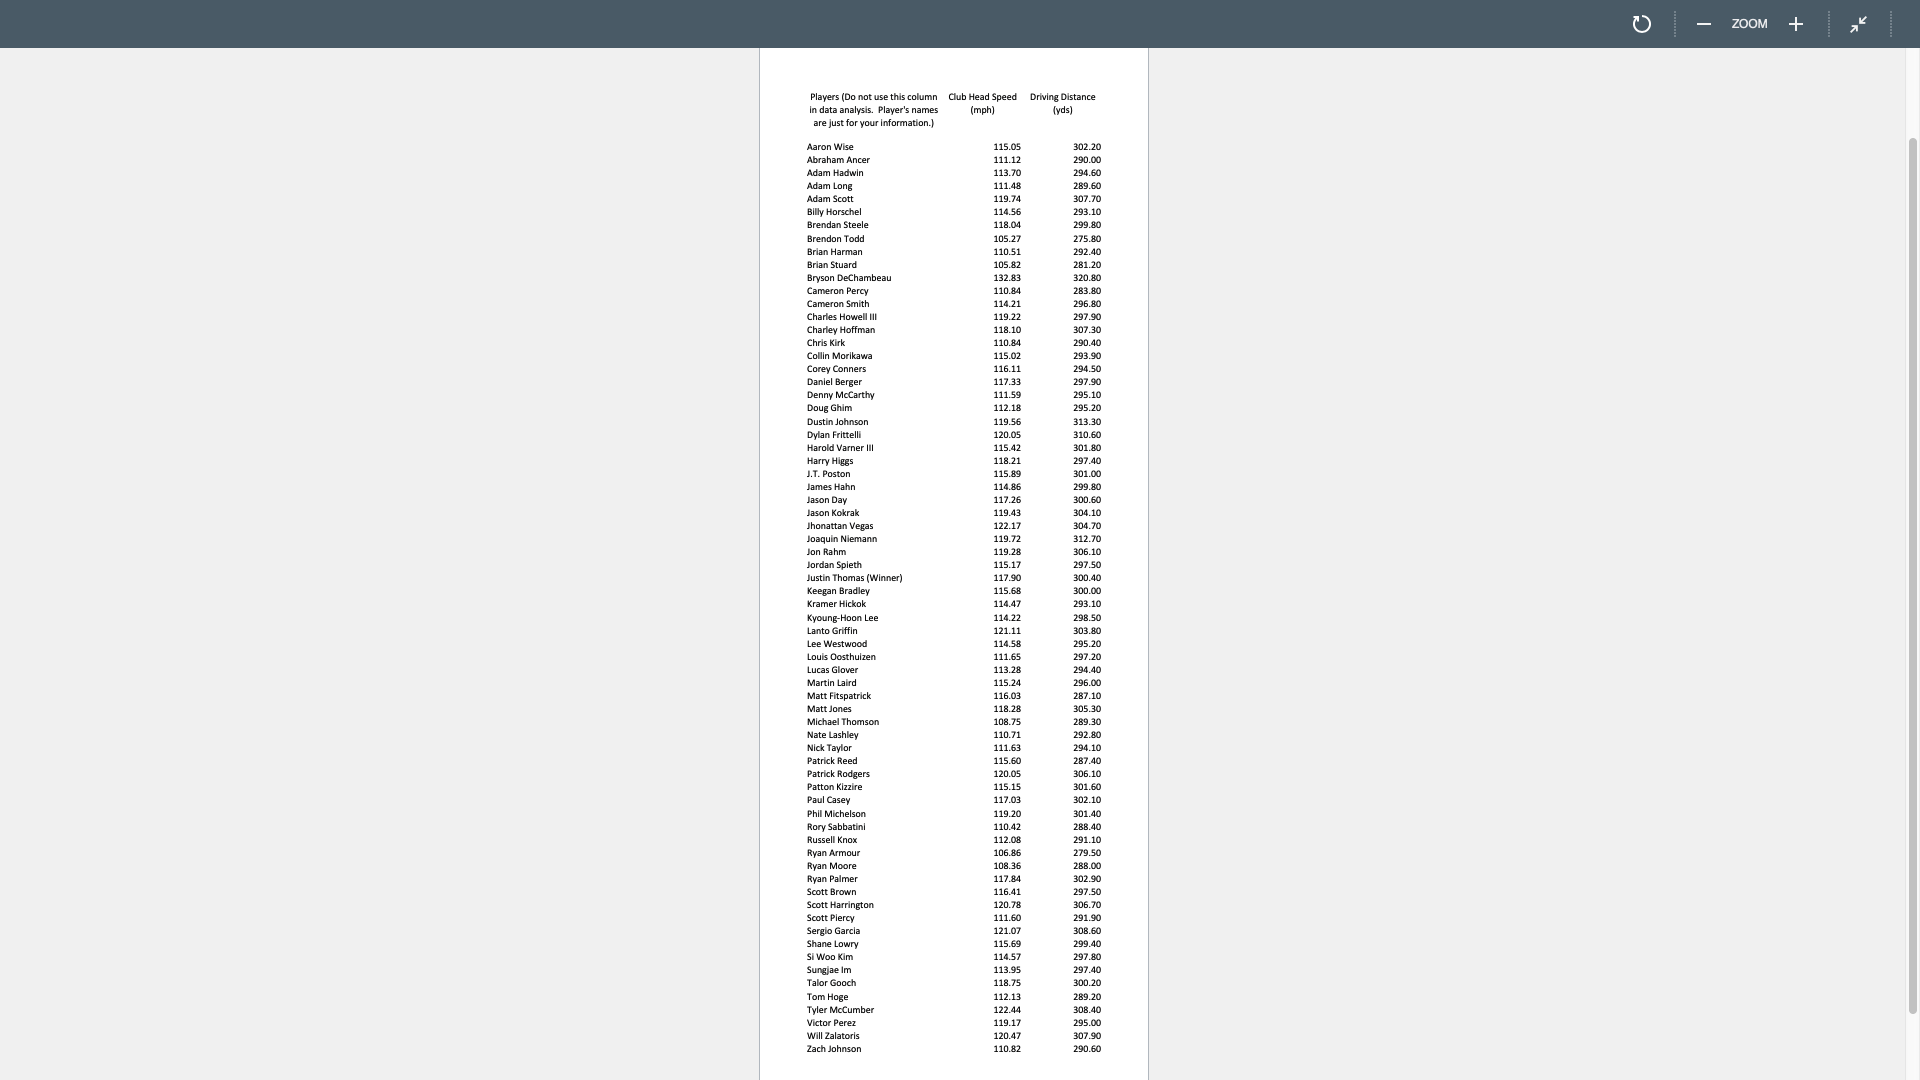
Q1. (10 pts)Review the output of driving distance.What is sample mean?When we estimate the true mean of driving distance with 95% confidence interval using this
Q1.(10 pts)Review the output of driving distance.What is sample mean?When we estimate the true mean of driving distance with 95% confidence interval using this sample, what is the margin of error?
Interpret your margin of error in the relation between mean of this sample (data from one randomly chosen tournament) and the true mean of population (all possible top player's performance).
Q2.(5 pts)With the answer of Q1, calculate95% confidence interval, [low endpoint, upper endpoint]for true mean of driving distance of top professional male golfers.Interpret the interval.
Let's describe theassociationbetween two characteristics.We call this bivariate analysis.
(Excel output: 10 pts)Run ExcelScatter Plotof"Club Head Speed" vs. "Driving Distance".
(Excel output: 5 pts)Run ExcelCorrelationbetween"Club Head Speed" vs. "Driving Distance".
Use the Scatter plot and correlation coefficient answering Q3.
Q3.(10 pts)Do you output verify the common sense (faster ball flies farther)?Explain the shape (direction and how tightly clustered) of the scatter plot of "Club Head Speed" vs. "Driving Distance".Does correlation coefficient support what scatter plot shows? Explain correlation coefficient's sign and magnitude and relate them with shape of scatter plot.
Let's check more details of the relation.To predict Driving Distance based on Club Head Speed, following linear model is examined usingregressionanalysis. (Assumptions about error term in simple linear regression are checked to be satisfied.)
y=b0+b1x
Q4.(4 pts)We are going to use two variables, "driving distance" and "club head speed" in regression, to predict "driving distance" based on "club head speed".Then, out of these two variables, which is Y and which is X?
(Excel output: 15 pts)Using driving distance" and "club head speed", runregressionin Excel data analysis. In regression option assignment, assign variables for X and Y as you answered in Q4.
Use regression output for answering Q5 through Q10.
Q5.(6 pts) Find the estimated y-intercept and estimated slope.Round your answer to three decimal places.
y-intercept:
slope:
Using all information above, write down the full equation of the regression model:
Q6.(5 pts)According to the estimated linear model, when the club head speed increases by one mile per hour, what happens to the estimated driving distance (in yards)?Use the estimated value from regression output.
Q7.(5 pts)Let's say you are going to predict/estimate certain player's driving distance using this linear model.If the player's club speed is 110.00 mph, what is the predicted driving distance?Round your answer to three decimal places.
Q8.(7 pts)Let's say there is a man who just started practicing and his club head speed is 83 mph.Would it be reasonable to predict his driving distance using the regression model you figured out above? Why or why not?
Q9.(8 pts)Report the coefficient of determination in three decimal places from regression output.What does this value mean?"Interpret" the value of coefficient of determination.
Q10.(for extra credit 5 pts)You used club head speed as the "sole predictor" of driving distance in this "simple" linear regression.What is (are) the possible limit(s) of this simple linear regression in predicting Driving Distance?
Step by Step Solution
There are 3 Steps involved in it
Step: 1

Get Instant Access to Expert-Tailored Solutions
See step-by-step solutions with expert insights and AI powered tools for academic success
Step: 2

Step: 3
Ace Your Homework with AI
Get the answers you need in no time with our AI-driven, step-by-step assistance
Get Started
Algebra And Trigonometry
Authors: Cynthia Y Young
3rd Edition
1118475755, 9781118475751