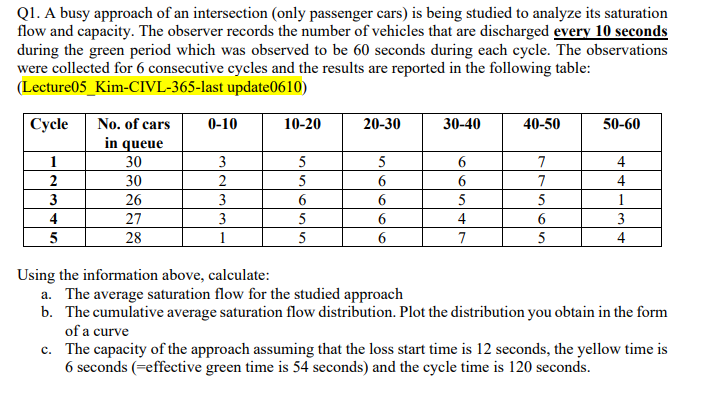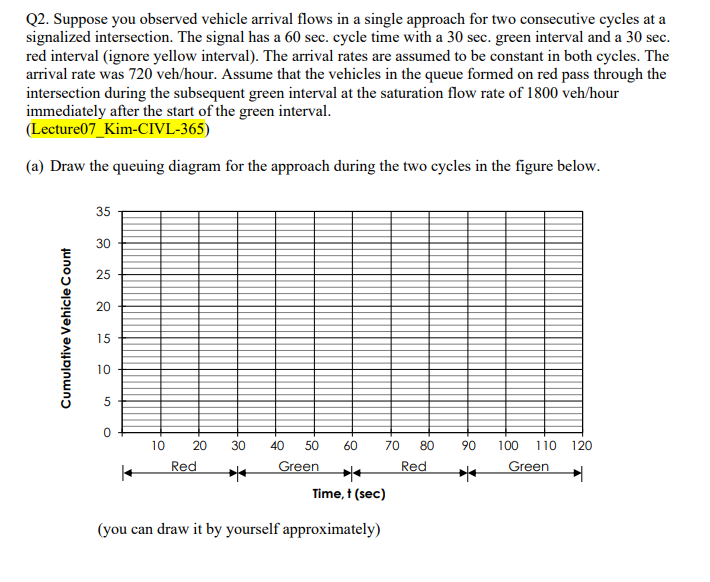


Q1. A busy approach of an intersection (only passenger cars) is being studied to analyze its saturation flow and capacity. The observer records the number of vehicles that are discharged every 10 seconds during the green period which was observed to be 60 seconds during each cycle. The observations were collected for 6 consecutive cycles and the results are reported in the following table: (Lecture05_Kim-CIVL-365-last update0610) Cycle No. of cars 0-10 10-20 20-30 30-40 40-50 50-60 in queue 2 30 30 26 27 28 3 2 3 3 4 5 5 5 6 5 5 5 6 6 6 6 6 6 5 4 7 7 7 5 6 5 4 4 1 3 4 Using the information above, calculate: a. The average saturation flow for the studied approach b. The cumulative average saturation flow distribution. Plot the distribution you obtain in the form of a curve c. The capacity of the approach assuming that the loss start time is 12 seconds, the yellow time is 6 seconds (=effective green time is 54 seconds) and the cycle time is 120 seconds. Q2. Suppose you observed vehicle arrival flows in a single approach for two consecutive cycles at a signalized intersection. The signal has a 60 sec. cycle time with a 30 sec. green interval and a 30 sec. red interval (ignore yellow interval). The arrival rates are assumed to be constant in both cycles. The arrival rate was 720 veh/hour. Assume that the vehicles in the queue formed on red pass through the intersection during the subsequent green interval at the saturation flow rate of 1800 veh/hour immediately after the start of the green interval. (Lecture07_Kim-CIVL-365) (a) Draw the queuing diagram for the approach during the two cycles in the figure below. 35 30 25 20 Cumulative Vehicle Count un 10 5 0 30 40 60 90 120 10 20 Red 50 Green 70 80 Red 100 110 Green Time,t (sec) (you can draw it by yourself approximately) (b) Calculate the total uniform delay per cycle. (c) Calculate the average delay per vehicle. (d) Calculate the maximum queue length (i.e. maximum number of vehicles in the queue). Q1. A busy approach of an intersection (only passenger cars) is being studied to analyze its saturation flow and capacity. The observer records the number of vehicles that are discharged every 10 seconds during the green period which was observed to be 60 seconds during each cycle. The observations were collected for 6 consecutive cycles and the results are reported in the following table: (Lecture05_Kim-CIVL-365-last update0610) Cycle No. of cars 0-10 10-20 20-30 30-40 40-50 50-60 in queue 2 30 30 26 27 28 3 2 3 3 4 5 5 5 6 5 5 5 6 6 6 6 6 6 5 4 7 7 7 5 6 5 4 4 1 3 4 Using the information above, calculate: a. The average saturation flow for the studied approach b. The cumulative average saturation flow distribution. Plot the distribution you obtain in the form of a curve c. The capacity of the approach assuming that the loss start time is 12 seconds, the yellow time is 6 seconds (=effective green time is 54 seconds) and the cycle time is 120 seconds. Q2. Suppose you observed vehicle arrival flows in a single approach for two consecutive cycles at a signalized intersection. The signal has a 60 sec. cycle time with a 30 sec. green interval and a 30 sec. red interval (ignore yellow interval). The arrival rates are assumed to be constant in both cycles. The arrival rate was 720 veh/hour. Assume that the vehicles in the queue formed on red pass through the intersection during the subsequent green interval at the saturation flow rate of 1800 veh/hour immediately after the start of the green interval. (Lecture07_Kim-CIVL-365) (a) Draw the queuing diagram for the approach during the two cycles in the figure below. 35 30 25 20 Cumulative Vehicle Count un 10 5 0 30 40 60 90 120 10 20 Red 50 Green 70 80 Red 100 110 Green Time,t (sec) (you can draw it by yourself approximately) (b) Calculate the total uniform delay per cycle. (c) Calculate the average delay per vehicle. (d) Calculate the maximum queue length (i.e. maximum number of vehicles in the queue)


