

Answered step by step
Verified Expert Solution
Question
1 Approved Answer
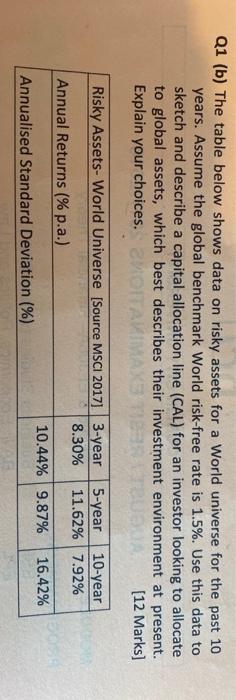
Q1 (b) The table below shows data on risky assets for a World universe for the past 10 years. Assume the global benchmark World risk-free
Step by Step Solution
There are 3 Steps involved in it
Step: 1

Get Instant Access to Expert-Tailored Solutions
See step-by-step solutions with expert insights and AI powered tools for academic success
Step: 2

Step: 3
Ace Your Homework with AI
Get the answers you need in no time with our AI-driven, step-by-step assistance
Get Started
Python For Finance
Authors: Yves Hilpisch
2nd Edition
1492024333, 978-1492024330