Answered step by step
Verified Expert Solution
Question
1 Approved Answer
Q1 Calculate the following ratios for BottomsUp 2018 2017 2016 Current ratio Quick ratio Receivable days Inventory turnover Inventory days Current asset turnover Fixed asset


Q1
| Calculate the following ratios for BottomsUp | |||
| 2018 | 2017 | 2016 | |
| Current ratio | |||
| Quick ratio | |||
| Receivable days | |||
| Inventory turnover | |||
| Inventory days | |||
| Current asset turnover | |||
| Fixed asset turnover | |||
| Total asset turnover | |||
| Long-term debt to total debt | |||
| Book debt-to-equity ratio | |||
| Gross profit ratio | |||
| Net profit ratio | |||
| Return on equity | |||
| Return on total assets | |||
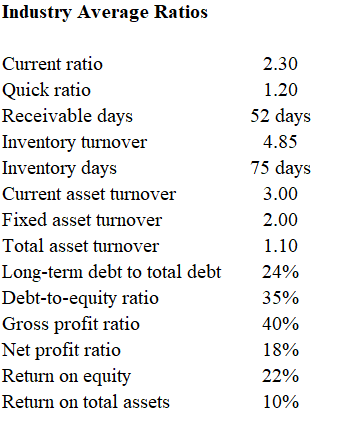
Q2: Compare BottomsUp profitability, leverage, and asset management to those of the average firm in the industry
Q3: BottomsUp has applied for a $7 million loan at a local bank. If you were a bank risk analyst, would you give BottomsUp this loan? Briefly explain your answer
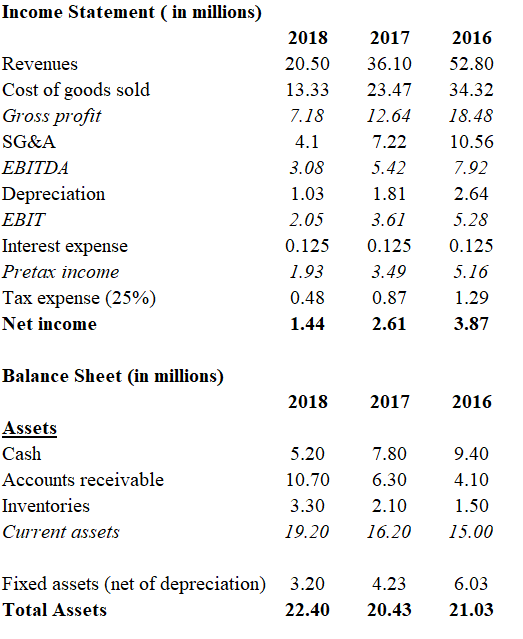
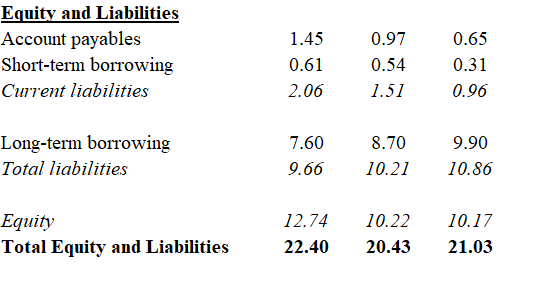
Industry Average Ratios Current ratio Quick ratio Receivable days Inventory turnover Inventory days Current asset turnover Fixed asset turnover Total asset turnover Long-term debt to total debt Debt-to-equity ratio Gross profit ratio Net profit ratio Return on equity Return on total assets 2.30 1.20 52 days 4.85 75 days 3.00 2.00 1.10 24% 35% 40% 18% 22% 10% Income Statement (in millions) 2018 20.50 13.33 7.18 4.1 3.08 Revenues Cost of goods sold Gross profit SG&A EBITDA Depreciation EBIT Interest expense Pretax income Tax expense (25%) Net income 2017 36.10 23.47 12.64 7.22 5.42 1.81 3.61 0.125 3.49 0.87 2.61 2016 52.80 34.32 18.48 10.56 7.92 2.64 5.28 0.125 5.16 1.29 3.87 1.03 2.05 0.125 1.93 0.48 1.44 Balance Sheet (in millions) 2018 2017 2016 Assets Cash Accounts receivable Inventories Current assets 5.20 10.70 3.30 19.20 7.80 6.30 2.10 16.20 9.40 4.10 1.50 15.00 Fixed assets (net of depreciation) Total Assets 3.20 22.40 4.23 20.43 6.03 21.03 Equity and Liabilities Account payables Short-term borrowing Current liabilities 1.45 0.61 2.06 0.97 0.54 1.51 0.65 0.31 0.96 Long-term borrowing Total liabilities 7.60 9.66 8.70 10.21 9.90 10.86 Equity Total Equity and Liabilities 12.74 22.40 10.22 20.43 10.17 21.03 Industry Average Ratios Current ratio Quick ratio Receivable days Inventory turnover Inventory days Current asset turnover Fixed asset turnover Total asset turnover Long-term debt to total debt Debt-to-equity ratio Gross profit ratio Net profit ratio Return on equity Return on total assets 2.30 1.20 52 days 4.85 75 days 3.00 2.00 1.10 24% 35% 40% 18% 22% 10% Income Statement (in millions) 2018 20.50 13.33 7.18 4.1 3.08 Revenues Cost of goods sold Gross profit SG&A EBITDA Depreciation EBIT Interest expense Pretax income Tax expense (25%) Net income 2017 36.10 23.47 12.64 7.22 5.42 1.81 3.61 0.125 3.49 0.87 2.61 2016 52.80 34.32 18.48 10.56 7.92 2.64 5.28 0.125 5.16 1.29 3.87 1.03 2.05 0.125 1.93 0.48 1.44 Balance Sheet (in millions) 2018 2017 2016 Assets Cash Accounts receivable Inventories Current assets 5.20 10.70 3.30 19.20 7.80 6.30 2.10 16.20 9.40 4.10 1.50 15.00 Fixed assets (net of depreciation) Total Assets 3.20 22.40 4.23 20.43 6.03 21.03 Equity and Liabilities Account payables Short-term borrowing Current liabilities 1.45 0.61 2.06 0.97 0.54 1.51 0.65 0.31 0.96 Long-term borrowing Total liabilities 7.60 9.66 8.70 10.21 9.90 10.86 Equity Total Equity and Liabilities 12.74 22.40 10.22 20.43 10.17 21.03Step by Step Solution
There are 3 Steps involved in it
Step: 1

Get Instant Access to Expert-Tailored Solutions
See step-by-step solutions with expert insights and AI powered tools for academic success
Step: 2

Step: 3

Ace Your Homework with AI
Get the answers you need in no time with our AI-driven, step-by-step assistance
Get Started


