

Answered step by step
Verified Expert Solution
Question
1 Approved Answer
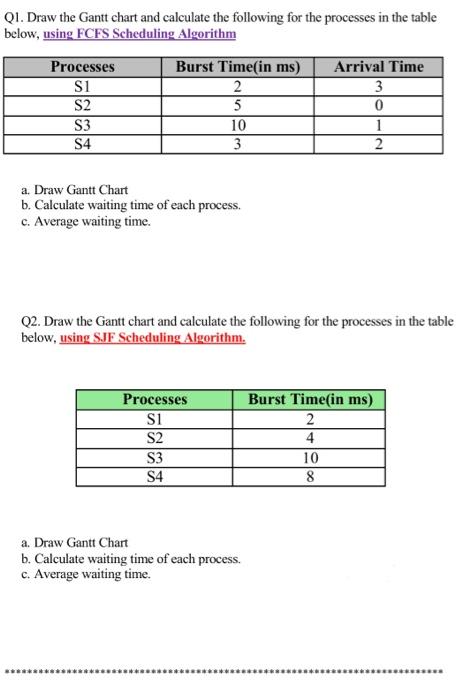
Q1. Draw the Gantt chart and calculate the following for the processes in the table below, using FCFS Scheduling Algorithm Processes S1 S2 S3 Burst
Step by Step Solution
There are 3 Steps involved in it
Step: 1

Get Instant Access to Expert-Tailored Solutions
See step-by-step solutions with expert insights and AI powered tools for academic success
Step: 2

Step: 3
Ace Your Homework with AI
Get the answers you need in no time with our AI-driven, step-by-step assistance
Get Started
Databases A Beginners Guide
Authors: Andy Oppel
1st Edition
007160846X, 978-0071608466