

Answered step by step
Verified Expert Solution
Question
1 Approved Answer
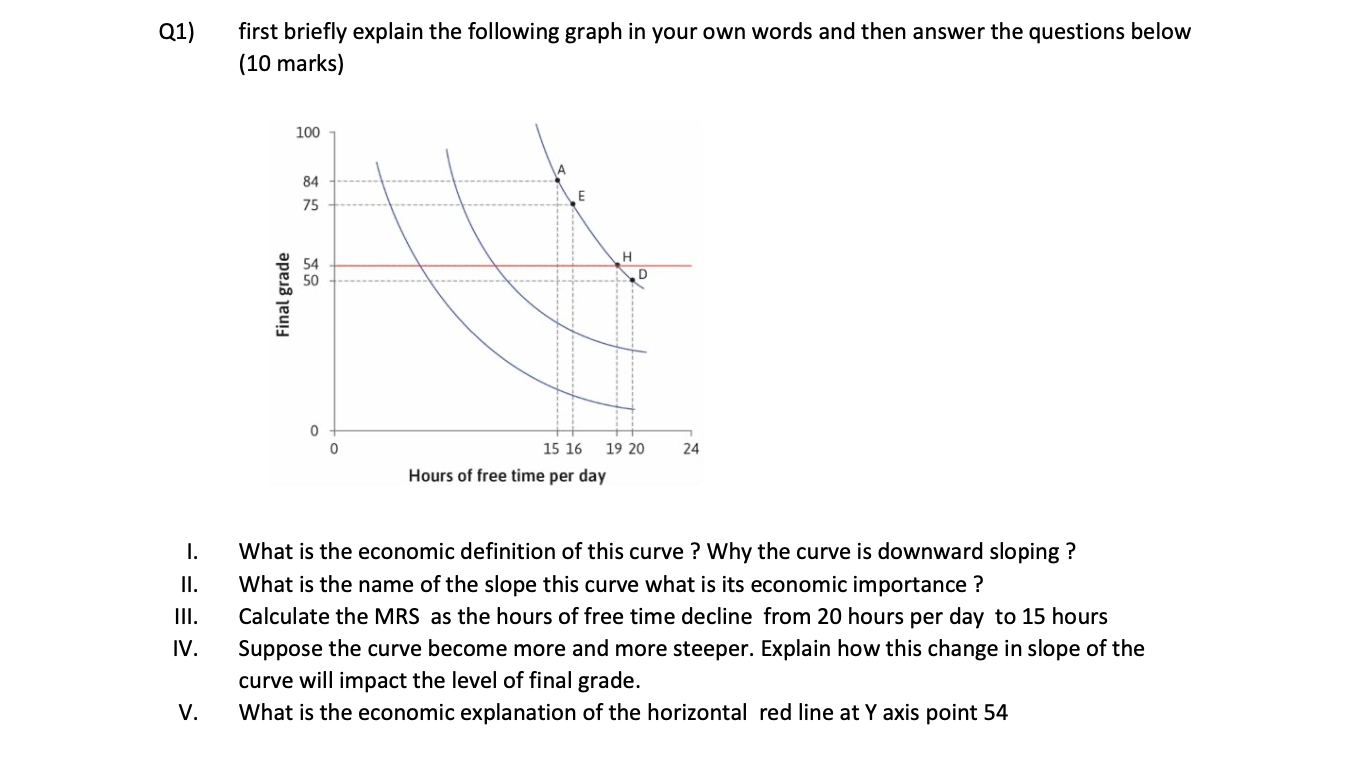
Q1) first briefly explain the following graph in your own words and then answer the questions below (10 marks) 100 84 75 D Final grade
Step by Step Solution
There are 3 Steps involved in it
Step: 1

Get Instant Access to Expert-Tailored Solutions
See step-by-step solutions with expert insights and AI powered tools for academic success
Step: 2

Step: 3
Ace Your Homework with AI
Get the answers you need in no time with our AI-driven, step-by-step assistance
Get Started
Principles Of Econometrics
Authors: R Hill
4th Edition
1118136969, 9781118136966