Question
Q#1. For the set of test scores ---100, 100, 98, 92, 90, 88, 84, 84, 84, 84, 76, 72, 66, 60, 55, 0, compute the
Q#1. For the set of test scores ---100, 100, 98, 92, 90, 88, 84, 84, 84, 84, 76, 72, 66, 60, 55, 0, compute the following measurements: (Pts: 1 + 1 + 1 + 1 + 1 + 2 + 2 = 9)
- n =
- mean =
- median =
- mode =
- range =
- variance =
- standard deviation =
Q#2. Which measure of central tendency in the above Q#1 better represents the distribution of scores, the mean, mode or the median? Explain your answer (1 +2 = 3 pts)
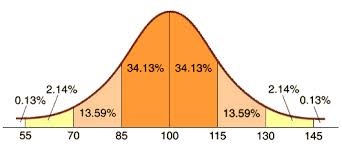
Question #3 below asks you to use normal curve to estimate the probability based on descriptive statistics - mean and SD of a sample statistics:
Q#3.Entry to a certain University is determined by a national test. The scores on this test are normally distributed with a mean of 500 and a standard deviation of 100. Tom wants to be admitted to this university and he knows that he must score better than at least 70% of the students who took the test. Tom takes the test and scored 600. Will he be admitted to this university, if so why? [show your work] (5 points)
The following problem for Q#4 is to assess on how to read the z-table and interpretthe table value when z-scores are given.
Q#4. What is the area between z=1.06 and z=4.00 under the standard normal curve?" (3 + 1 = 4 points) [table source:http://www.z-table.com/ ]
(Hint: what is wanted is the proportion of scores that lie below the z-score corresponding to the raw score of 70.) Must use z formula to compute z and then use z-table to find the area.

Step by Step Solution
There are 3 Steps involved in it
Step: 1

Get Instant Access to Expert-Tailored Solutions
See step-by-step solutions with expert insights and AI powered tools for academic success
Step: 2

Step: 3

Ace Your Homework with AI
Get the answers you need in no time with our AI-driven, step-by-step assistance
Get Started


