Answered step by step
Verified Expert Solution
Link Copied!

Question

1 Approved Answer

Q1. From a large number of actuarial exam scores, a random sample of 375 scores is selected, and it is found that 258 of these

image text in transcribedimage text in transcribed

Q1.

From a large number of actuarial exam scores, a random sample of 375 scores is selected, and it is found that

258 of these 375 are passing scores. Based on this sample, find a 95%

confidence interval for the proportion of all scores that are passing. Then find the lower limit and upper limit of the 95% confidence interval.

Carry your intermediate computations to at least three decimal places. Round your answers to two decimal places.

Lower limit:
Upper limit:

Q2.

A union of restaurant and foodservice workers would like to estimate the mean hourly wage, ?, of foodservice workers in the U.S. The union will choose a random sample of wages and then estimate ? using the mean of the sample. What is the minimum sample size needed in order for the union to be 95% confident that its estimate is within $0.45 of ? ? Suppose that the standard deviation of wages of foodservice workers in the U.S. is about $2.10.

Carry your intermediate computations to at least three decimal places. Write your answer as a whole number (and make sure that it is the minimum whole number that satisfies the requirements).

Q3

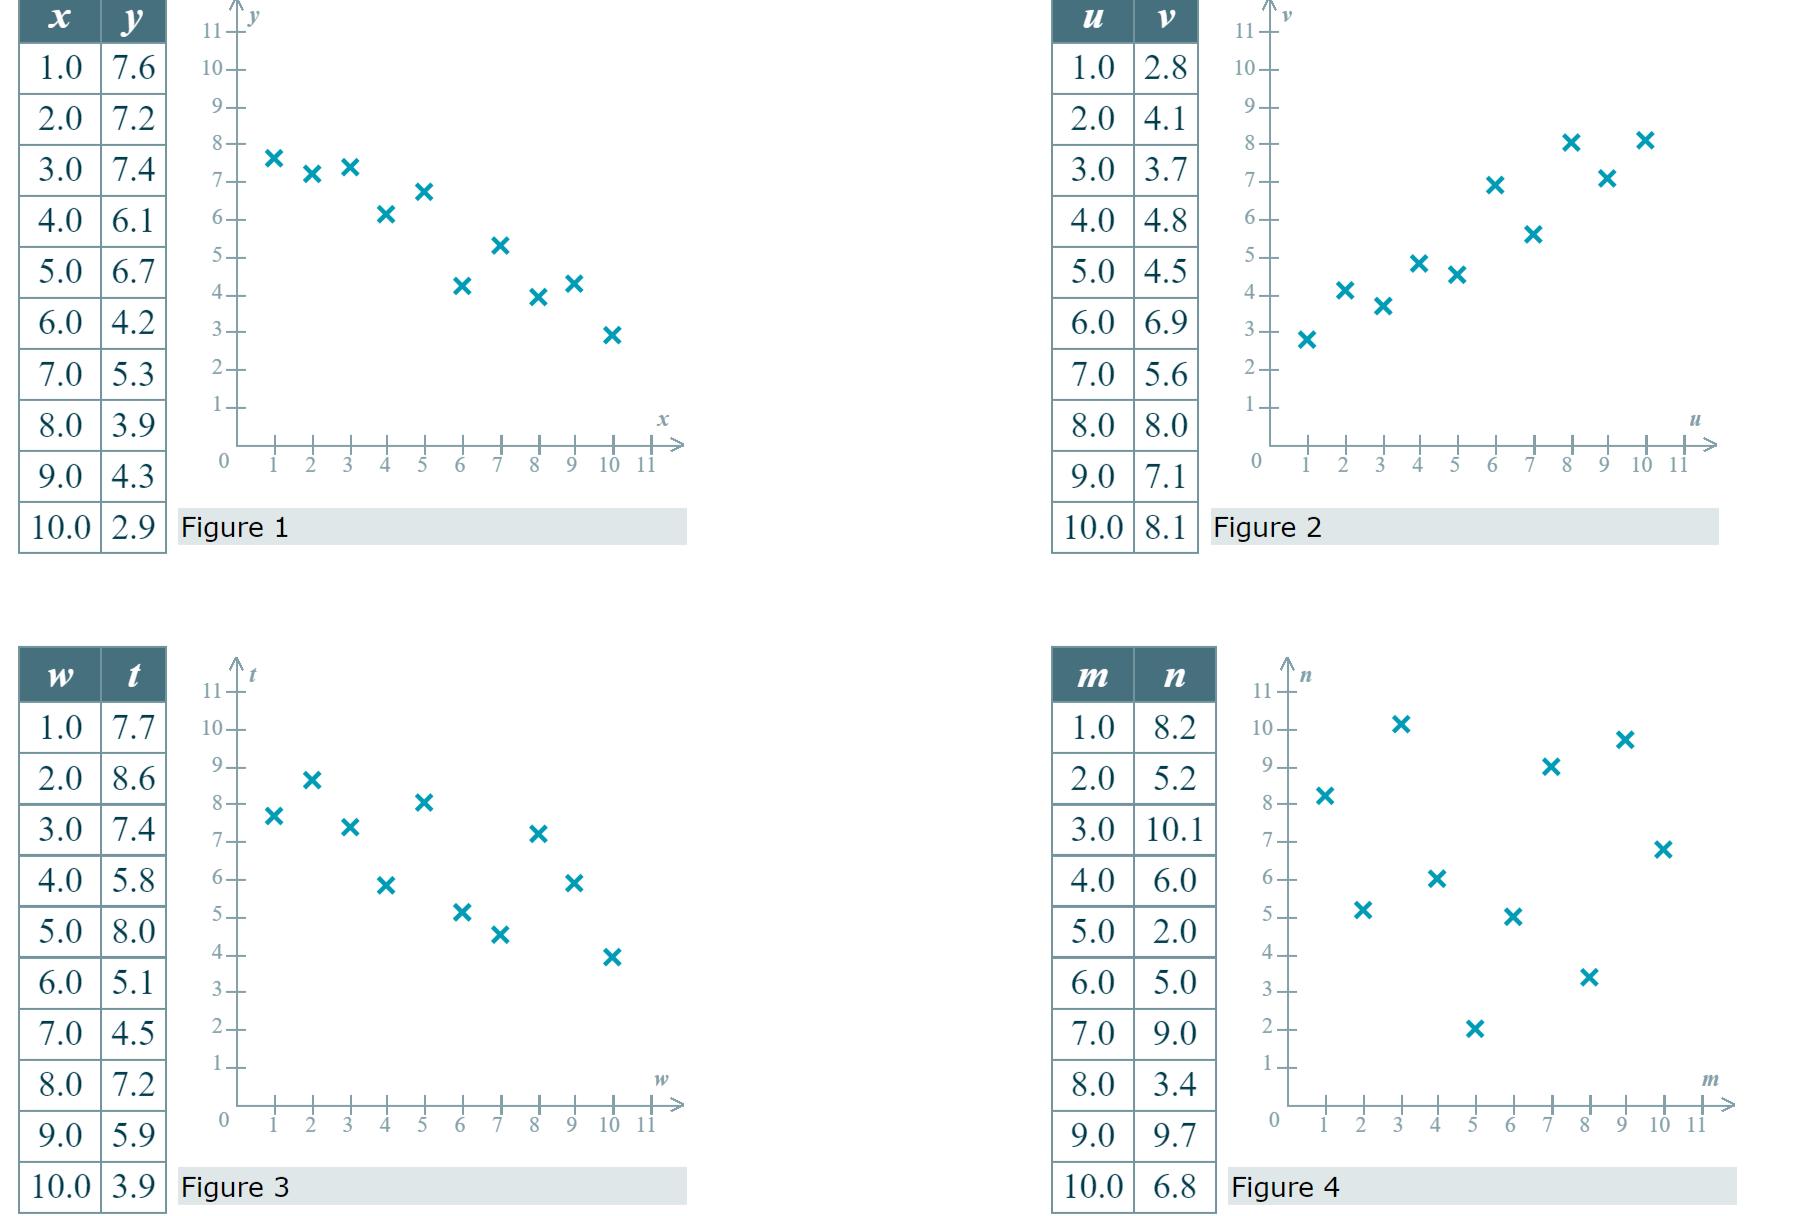
Below are four bivariate data sets and their scatter plots. (Note that all of the scatter plots are displayed with the same scale.) Each data set is made up of sample values drawn from a population.

image text in transcribedimage text in transcribedimage text in transcribed
X y u V 1.0 7.6 10- 1.0 2.8 10- 2.0 7.2 2.0 4.1 8 - X X X 3.0 7.4 X X 3.0 3.7 X X X 4.0 6.1 X 4.0 4.8 X X 5.0 6.7 X X X 5.0 4.5 XX X 6.0 4.2 X X 6.0 6.9 X 7.0 15.3 7.0 5.6 8.0 3.9 8.0 8.0 9.0 4.3 9.0 7.1 10.0 2.9 Figure 1 10.0 8.1 Figure 2 W 11 - m n 11In 1.0 7.7 10- 1.0 8.2 10- X X 9. 2.0 8.6 X 2.0 5.2 9 _ X 8- X 3.0 7.4 X X 8- X X 3.0 10.1 X 4.0 5.8 X X 4.0 6.0 X 5.0 8.0 X X X 5.0 2.0 X X 6.0 5.1 6.0 5.0 X 7.0 4.5 7.0 9.0 X 8.0 7.2 8.0 3.4 9.0 5.9 9.0 9.7 10.0 3.9 Figure 3 10.0 6.8 Figure 41980 per 1999 per capita capita income, x income, y xy (in $1000s) (in $1000s) 38- New York 11.1 33.9 376.29 36- X New Hampshire 9.9 30.9 305.91 34+ X Arkansas 7.6 22.1 167.96 32- X . Maine 8.4 25.0 210 30- X Montana 9.1 22.3 202.93 1999 per capita income (in $1000s) 28- X X Indiana 9.4 26.1 245.34 26- X X X Washington 10.9 30.3 330.27 24_ Arizona 9.6 25.3 242.88 22- X X Michigan 10.4 27.8 289.12 20- New Jersey 11.8 36.1 425.98 Florida 10.0 10 12 28.0 280 13 Louisiana 8.8 22.8 200.64 1980 per capita income Vermont 8.7 25.9 225.33 (in $1000s) Minnesota 10.3 30.6 315.18 Figure 1 Idaho 8.7 23.4 203.58An advertising firm wishes to demonstrate to its clients the effectiveness of the advertising campaigns it has conducted. The following bivariate data on twelve recent campaigns, including the cost of each campaign (in millions of dollars) and the resulting percentage increase in sales following the campaign, were A presented by the firm. Based on these data, we would compute the least-squares regression line to be y = 6.20 +0.17x, with x representing campaign cost and y representing the resulting percentage increase in sales. (This line is shown below, along with a scatter plot of the data.) Campaign cost, x Increase in sales, y (in millions of dollars) (percent) y 3.70 6.80 72 3.17 6.53 7 1.46 6.36 m 4.06 6.99 6'8 2.93 6.96 E g 6-6 w ._ 2.96 6.61 g g 5.. 2.00 6.52 g ,2 x 2.14 6.81 6 1.70 6.22 x 333 6.74 @ l 2' .L g J 2.33 6.53 Campaign cost 1 36 6 59 (in millions of dollars)

Step by Step Solution

There are 3 Steps involved in it

Step: 1

blur-text-image

Get Instant Access to Expert-Tailored Solutions

See step-by-step solutions with expert insights and AI powered tools for academic success

Step: 2

blur-text-image

Step: 3

blur-text-image

Ace Your Homework with AI

Get the answers you need in no time with our AI-driven, step-by-step assistance

Get Started

Recommended Textbook for

Climate Mathematics Theory And Applications

Authors: Samuel S P Shen, Richard C J Somerville

1st Edition

1108750184, 9781108750189

More Books

Students also viewed these Mathematics questions