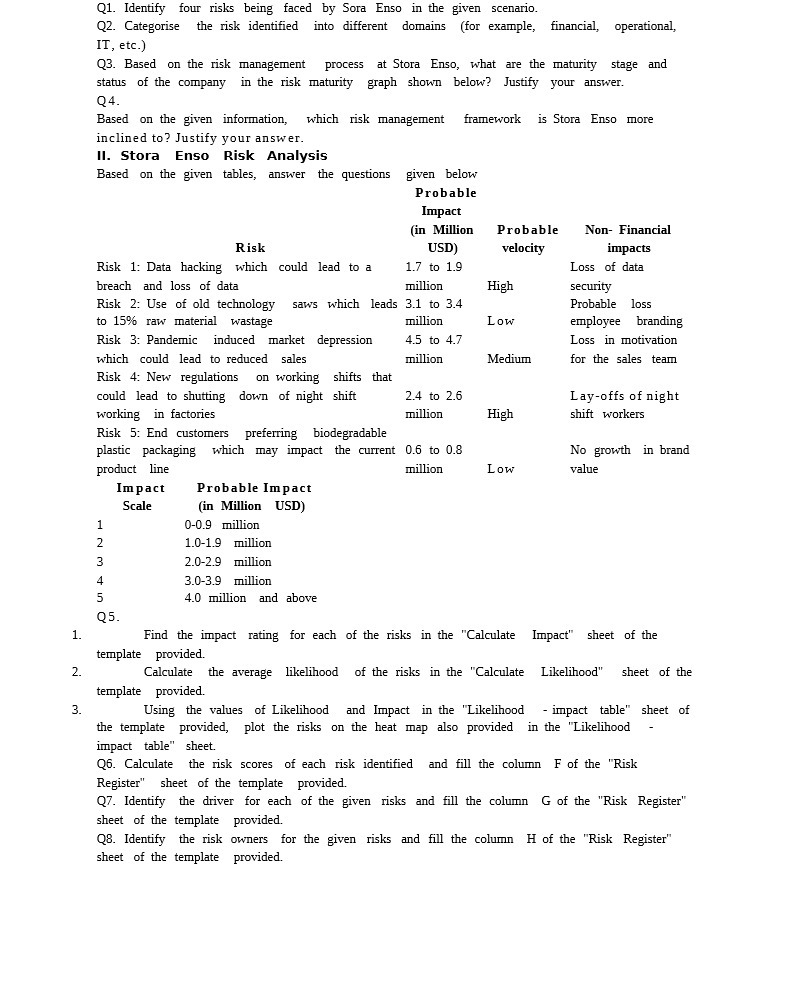
Q1. Identify fom' risks being faced by Sora Enso in the given scenario. Q2. Categorise the risk identied into different domains [for example, financial, operational, IT, etc.) Q3. Based on the risk management process at Stora Enso, what are the maturity stage and status of the company intl'le risk matln'ity graph shown below? Justify your answer. Q4. Based on the given information, which risk management mnework is Store Enso more inclined to? lustify your answer. II. Stora Enso Risk Analysis Based on the given tables, answer the questions given below Probable Impact [in ll'Iillion Probable Non- Financial Risk USD] \"docin impacts Risk 1: Data hacking which could lead to a 1.? to 1.9 Loss of data breach and loss of data million High secmity Risk 2: Use of old technology saws which leads 3.1 to 3.4 Probable loss to 15% raw material wastage million Low employee branding Risk 3: Pandemic induced market depression 4.5 to 4.? Loss in motivation which could lead to reduced sales million Medium for the sales team Risk 4-: New regulations on working shifts that could lead to shutting down of night shift 2.4 to 2.6 Lay-offs of night working in factories million High shift workers Risk 5: End customers preferring biodegradable plastic packaging which may impact the current 0.5 to 0.3 No growth in brand product line million Low value Impact Probable Impact Scale [in Million USD} 1 0-0.9 million 2 1.0-1.9 million 3 2.0-2.9 million 4 3.0-3.9 million 5 4.0 million and above Q5. Find the impact rating for each of the risks in the "Calculate Impact" sheet of the template provided. Calculate the average likelihood of the risks in the "Calculate Likelihood" sheet of the template provided. Using the values of Likelihood and Impact iuthe "Likelihood impact table" sheet of the template provided, plot the risks on the heat map also provided in the "Likelihood impact table" sheet QB. Calculate the risk scores of each risk identied and till the column F of the "Risk Register" sheet of the template provided. QT. Identify the driver for each of the given risks and ll the column G of the "Risk Register" sheet of the template provided. Q3. Identify the risk owners for the given risks and ll the column H of the "Risk Register" sheet of the template provided


