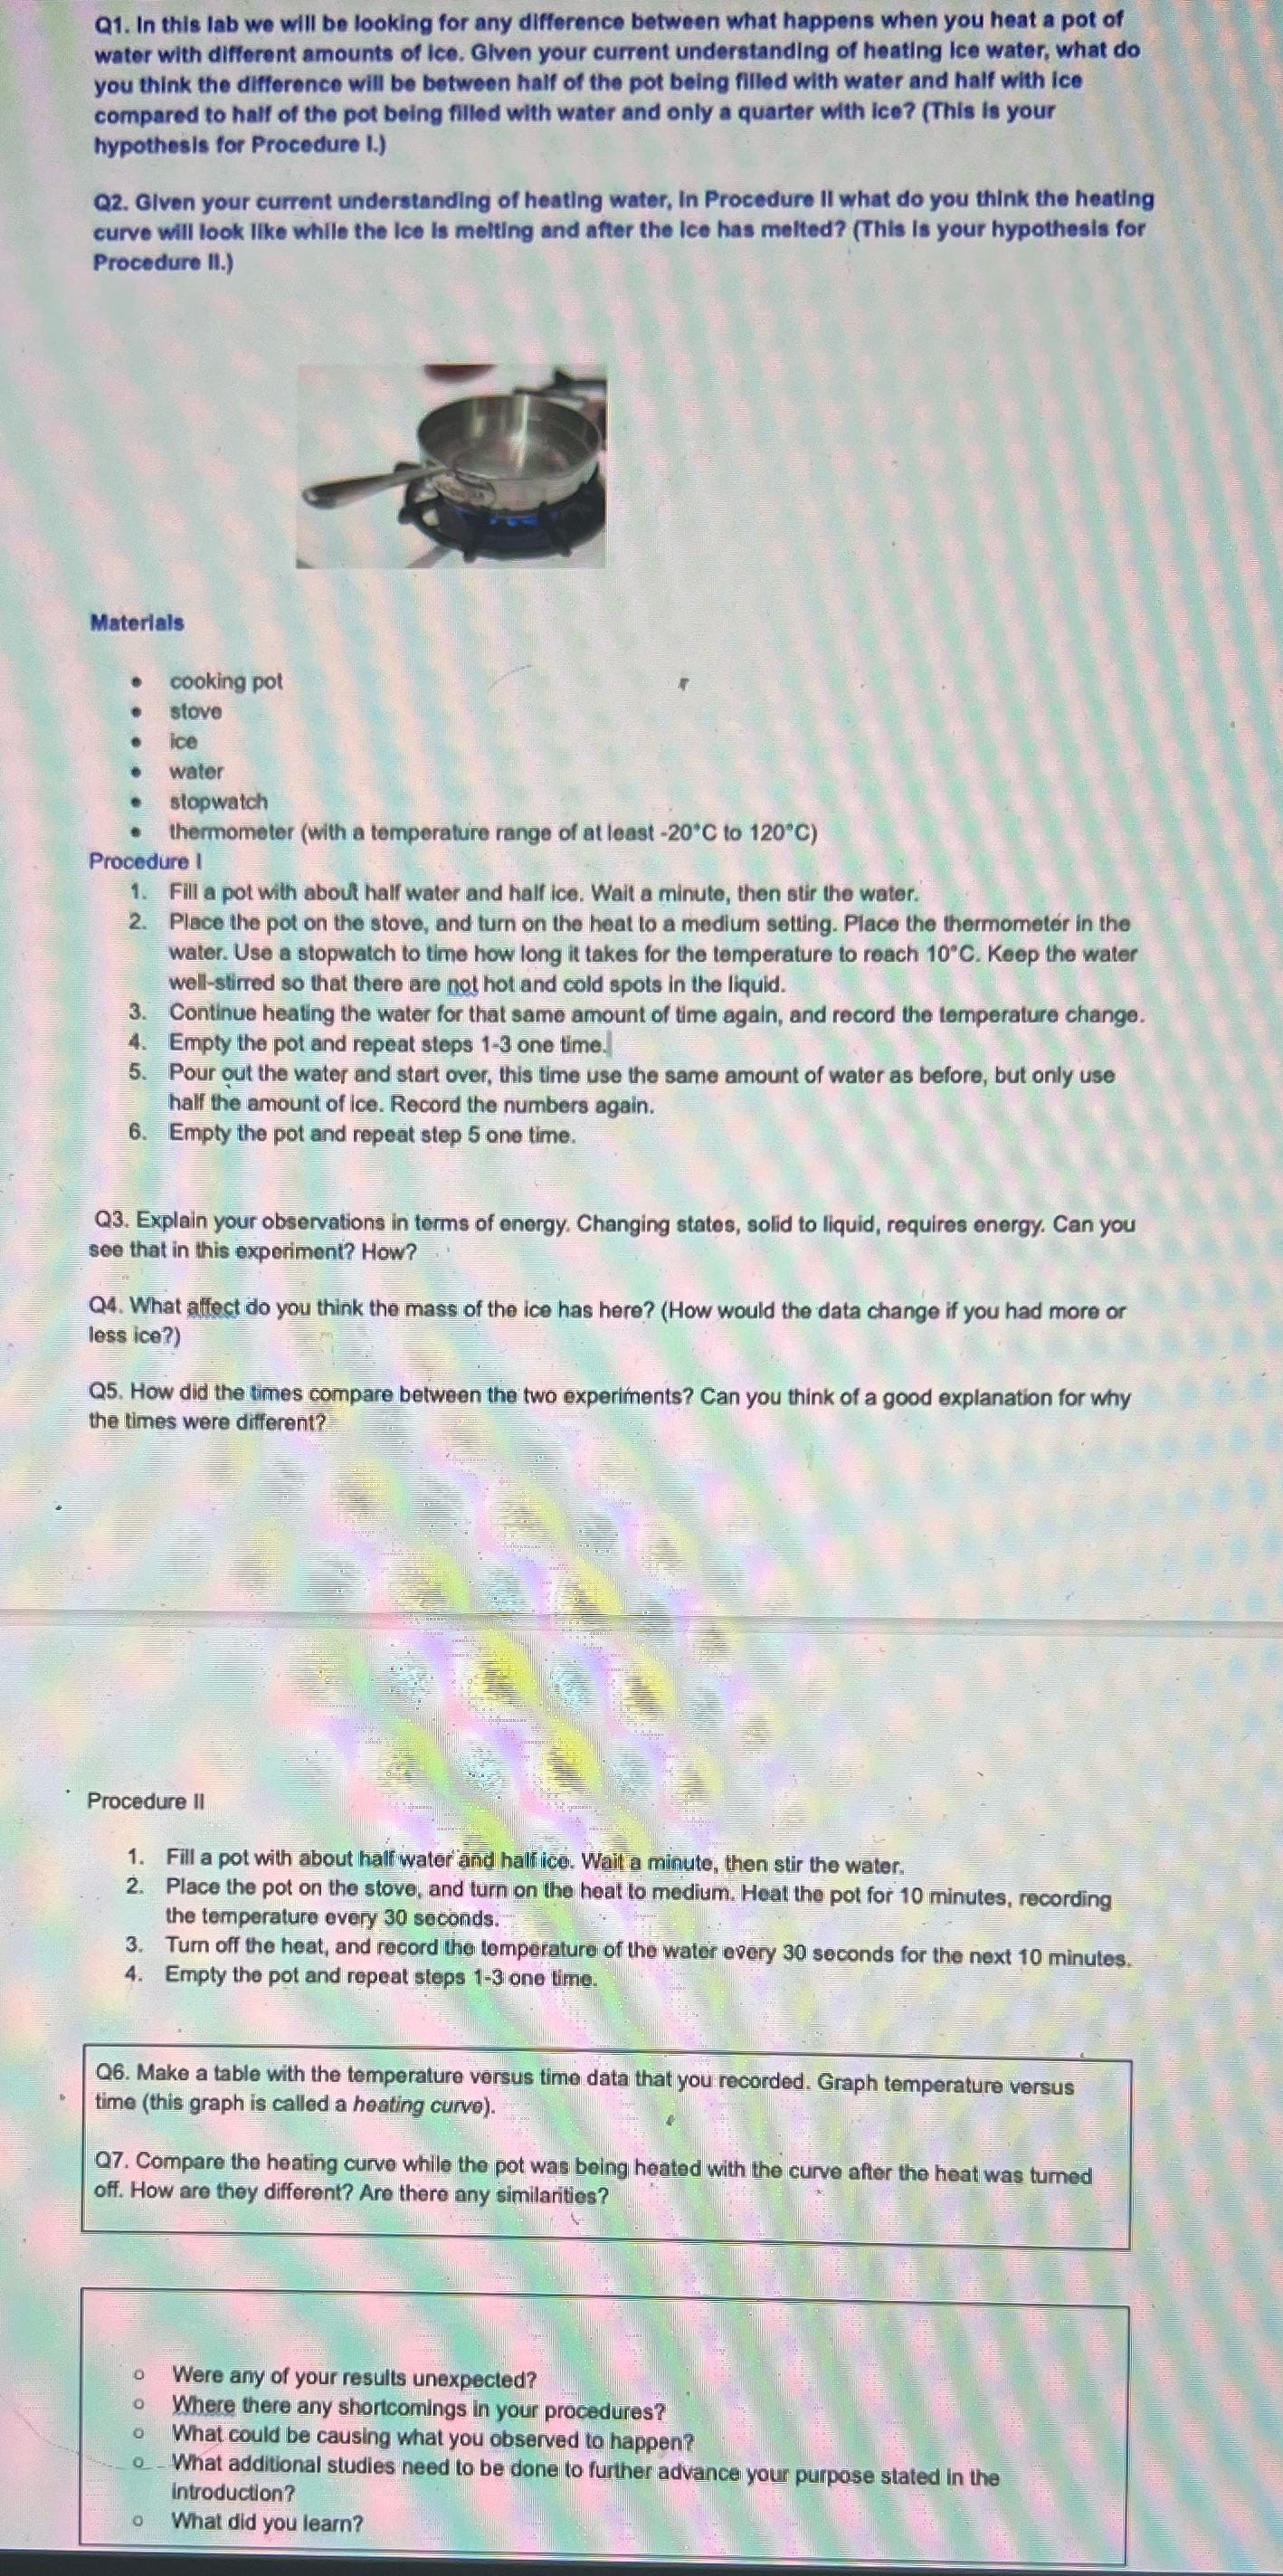
Q1. In this lab we will be looking for any difference between what happens when you heat a pot of water with different amounts of ice. Given your current understanding of heating ice water, what do you think the difference will be between half of the pot being filled with water and half with ice compared to half of the pot being filled with water and only a quarter with ice? (This is your hypothesis for Procedure I.) Q2. Given your current understanding of heating water, In Procedure II what do you think the heating curve will look like while the Ice Is melting and after the Ice has melted? (This Is your hypothesis for Procedure II.) Materials . cooking pot stove ice water stopwatch thermometer (with a temperature range of at least -20*C to 120"C) Procedure I 1. Fill a pot with about half water and half ice. Wait a minute, then stir the water. 2. Place the pot on the stove, and turn on the heat to a medium setting. Place the thermometer in the water. Use a stopwatch to time how long it takes for the temperature to reach 10"C. Keep the water well-stirred so that there are not hot and cold spots in the liquid. Continue heating the water for that same amount of time again, and record the temperature change. 4. Empty the pot and repeat steps 1-3 one time. 5 . Pour out the water and start over, this time use the same amount of water as before, but only use half the amount of ice. Record the numbers again. 6. Empty the pot and repeat step 5 one time. Q3. Explain your observations in terms of energy. Changing states, solid to liquid, requires energy. Can you see that in this experiment? How?' Q4. What affect do you think the mass of the ice has here? (How would the data change if you had more or less ice?) Q5. How did the times compare between the two experiments? Can you think of a good explanation for why the times were different? * Procedure II 1. Fill a pot with about half water and half ice. Wait a minute, then stir the water. 2. Place the pot on the stove, and turn on the heat to medium. Heat the pot for 10 minutes, recording the temperature every 30 seconds. 3. Turn off the heat, and record the temperature of the water every 30 seconds for the next 10 minutes. 4. Empty the pot and repeat steps 1-3 one time. Q6. Make a table with the temperature versus time data that you recorded. Graph temperature versus time (this graph is called a heating curve). Q7. Compare the heating curve while the pot was being heated with the curve after the heat was turned off. How are they different? Are there any similarities? Were any of your results unexpected? Where there any shortcomings in your procedures? What could be causing what you observed to happen? -What additional studies need to be done to further advance your purpose stated in the Introduction? What did you learn