

Answered step by step
Verified Expert Solution
Question
1 Approved Answer
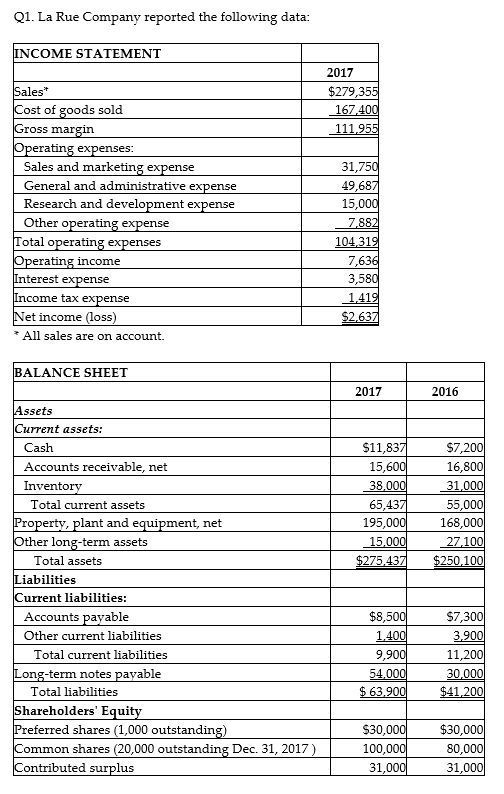
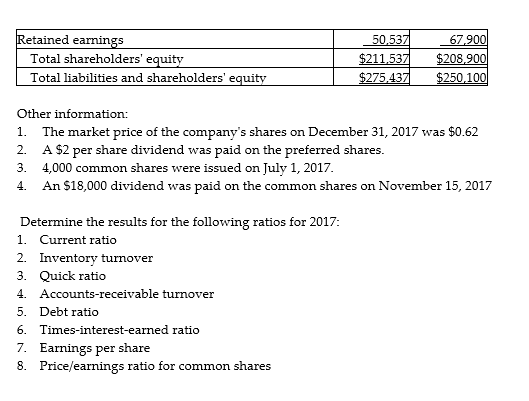
Q1. La Rue Company reported the following data: INCOME STATEMENT 2017 Sales* $279,355 Cost of goods sold 167,400 Gross margin 111,955 Operating expenses: Sales and
Step by Step Solution
There are 3 Steps involved in it
Step: 1

Get Instant Access to Expert-Tailored Solutions
See step-by-step solutions with expert insights and AI powered tools for academic success
Step: 2

Step: 3
Ace Your Homework with AI
Get the answers you need in no time with our AI-driven, step-by-step assistance
Get Started
Managerial Accounting
Authors: Ronald W Hilton
7th Edition
0073022853, 978-0073022857