Question
Q1 - Part A The further up a mountain you go, the less fizzy a fizzy drink becomes because the carbon dioxide escapes from the
Q1 - Part A
The further up a mountain you go, the less fizzy a fizzy drink becomes because the carbon dioxide escapes from the drink when the atmospheric pressure is lowered. You get a sample of fizzy drink consumers and require them to score a sparkling water drink for fizziness at the top of the mountain and at the bottom of the mountain. You compare their mean scores and find a difference. You want to see if the difference in means obtained from your group of consumers in your experiment represents what would be obtained from the whole population of fizzy drink consumers. What statistical test would you use?
Q1 - Part B
In the experiment in Q1 - Part A, you noticed that the mean score for fizziness at the top of the mountain was less than at the bottom. You wanted to know if this was something that a significant majority of consumers reported. What test would you use to determine this?
Q1 - Part C
What statistical test would you use if you had different people taste the sparkling water at the top and at the bottom of the mountain for the experiment described in Q1 - Part A?
Q1 - Part D
You want to know whether Scottish people are better at smoking salmon than Alaskans. You take samples of smoked salmon from eight producers in Scotland and seven in Alaska. A team of experts rate the salmon samples and give each producer an overall consensus score. These scores are averaged (the mean was taken) over the producers in Scotland and the producers in Alaska. The mean is higher for the Scottish producers. But does this result generalize to all producers in Scotland and Alaska? What statistical test would you use to answer this question?
Q2
Dr. Idiot tested two air fresheners (LA Smog and Detroit Yuk). He used twenty judges to rate the citrus odor strength of each freshener. He performed a related samples t test. He found that the Detroit Yuk freshener had a higher mean odor strength score. On seeing this, he decided he now knew which freshener would have the stronger citrus odor so he could use a one-tailed test.
Was he right to use a related samples test? Say why.
When would he have used an independent samples test?
Was he justified in choosing a one-tailed test?
Q3
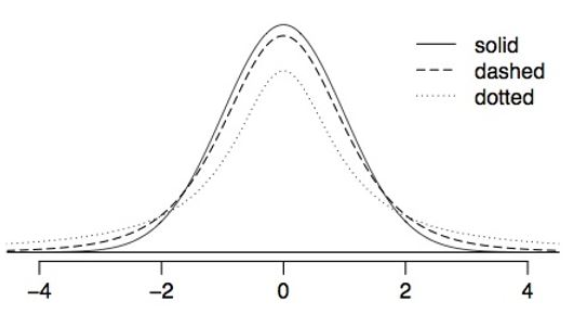
The figure below shows three unimodal and symmetric curves, which assignment ismost plausible?
Step by Step Solution
There are 3 Steps involved in it
Step: 1

Get Instant Access to Expert-Tailored Solutions
See step-by-step solutions with expert insights and AI powered tools for academic success
Step: 2

Step: 3

Ace Your Homework with AI
Get the answers you need in no time with our AI-driven, step-by-step assistance
Get Started


