Question
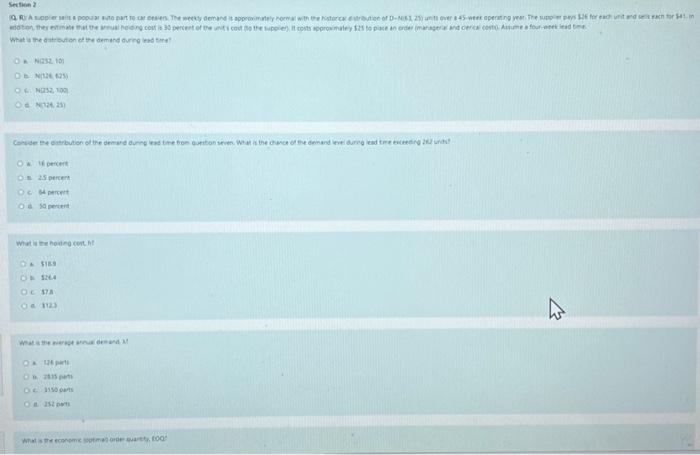
Q1: ( Q, R ): A supplier sells a popular auto part to car dealers. The weekly demand is approximately normal with the historical distribution
What is the distribution of the demand during lead time?
Q2: Consider the distribution of the demand during lead time from question seven. What is the chance of the demand level during lead time exceeding 262 units?
Q3: What is the holding cost, h?
Q4: What is the average annual demand, ?
Q5: What is the economic (optimal) order quantity, EOQ?
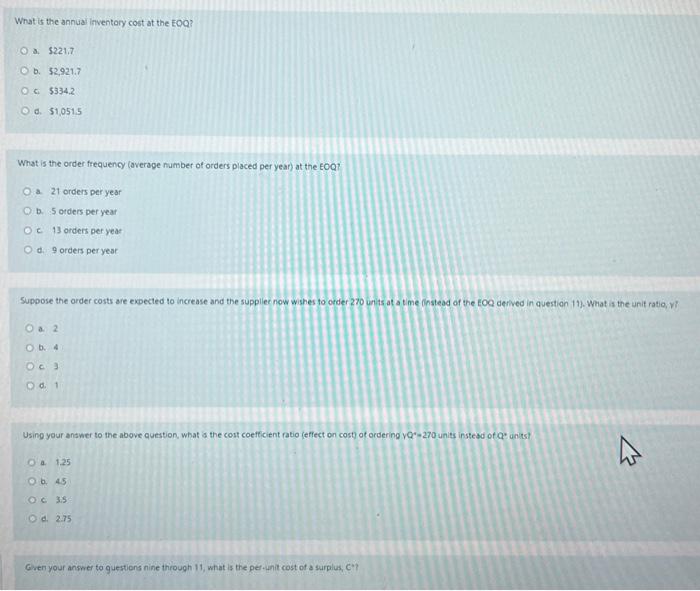
Q6: What is the annual inventory cost at the EOQ?
Q7: What is the order frequency (average number of orders placed per year) at the EOQ?
Q8: Suppose the order costs are expected to increase and the supplier now wishes to order 270 units at a time (instead of the EOQ derived in question 5). What is the unit ratio, ?
Q9: Using your answer to the above question, what is the cost coefficient ratio (effect on cost) of ordering Q*=270 units instead of Q* units?
Q10: Given your answer to questions nine through 11, what is the per-unit cost of a surplus, C+?
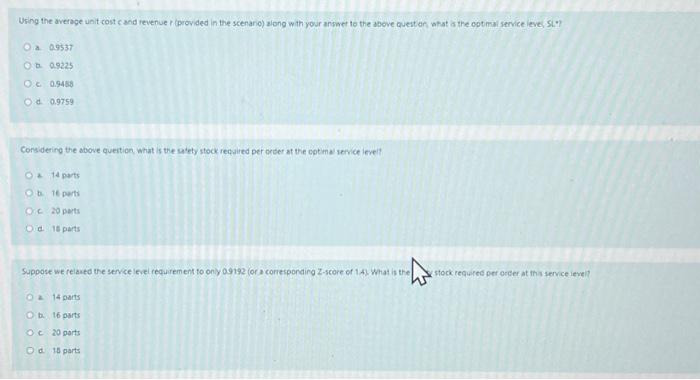
Q11: Using the average unit cost c and revenue r (provided in the scenario) along with your answer to the above question, what is the optimal service level, SL*?
Q12: Considering the above question, what is the safety stock required per order at the optimal service level?
Q13: Suppose we relaxed the service level requirement to only 0.9192 (or a corresponding Z-score of 1.4). What is the safety stock required per order at this service level?


Step by Step Solution
There are 3 Steps involved in it
Step: 1

Get Instant Access to Expert-Tailored Solutions
See step-by-step solutions with expert insights and AI powered tools for academic success
Step: 2

Step: 3

Ace Your Homework with AI
Get the answers you need in no time with our AI-driven, step-by-step assistance
Get Started


