Q1. See figures 2 and 5 in Graham (2022). These two figures show how CFO responded to 1) capital budget techniques frequently used, and 2) estimation of the cost of equity. Interestingly, it is common for many firms to use NPV/IRR and CAPM. As the author mentioned, a company's finance decision-making does not change as much over several decades. We have already learned many shortcomings of the traditional techniques and models, but why are these techniques adopted in practice? What makes firms exploit these "old" techniques to "current" decisions?
Pick ONE of the important factors or reasons (from this paper or textbook) to fill the gap between our common perception and the practitioner's choice. Then, introduce any real-world example to support your observation.
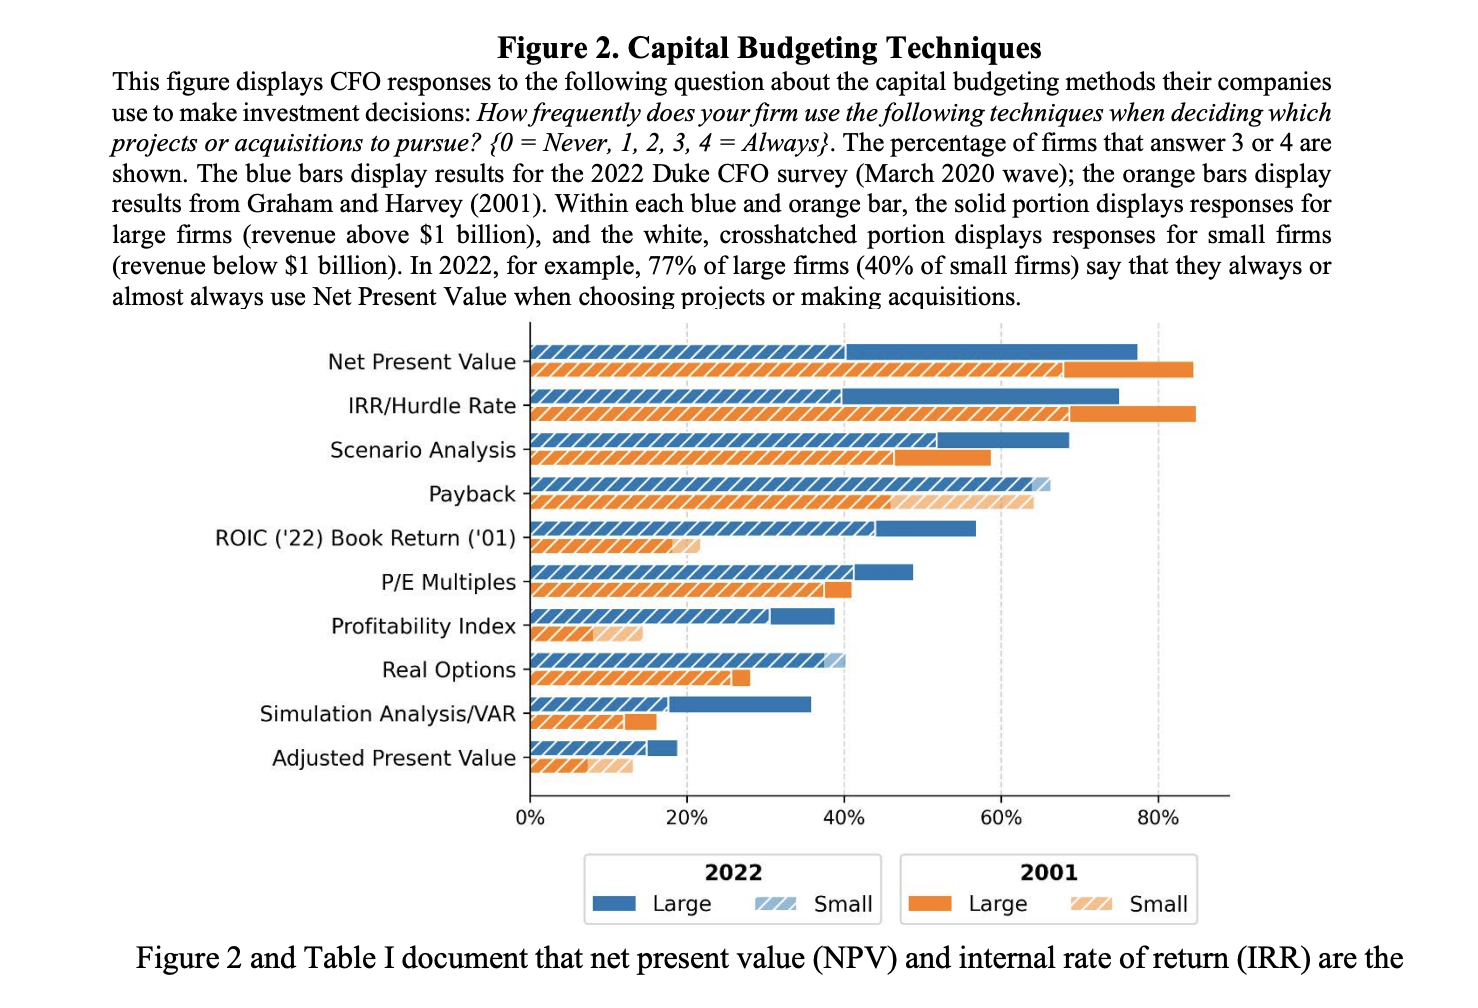
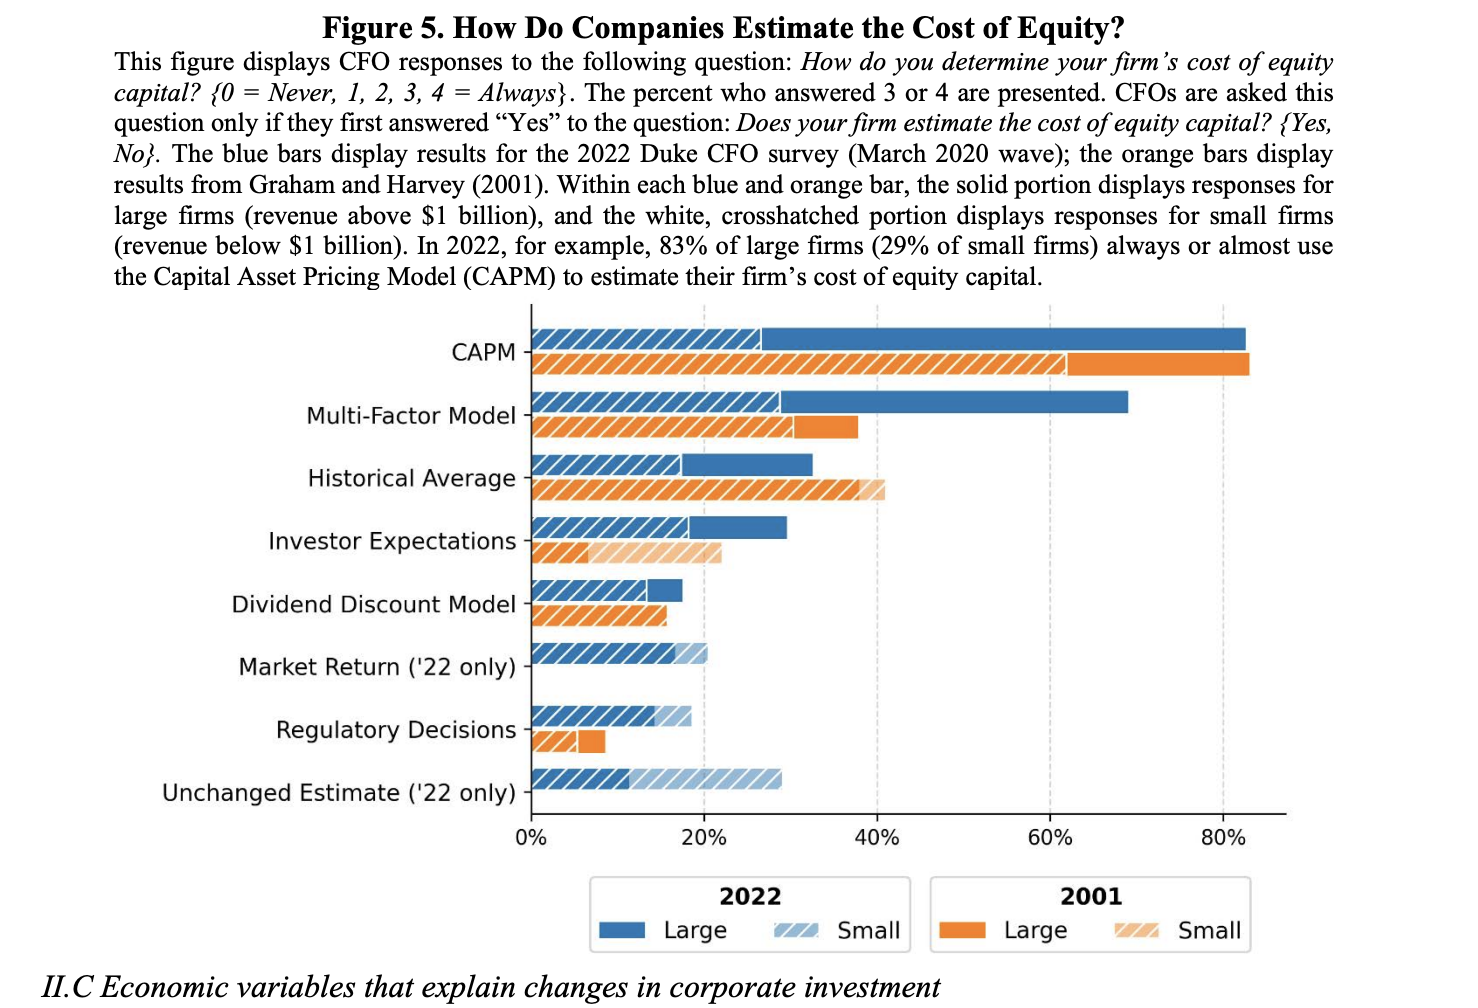
= = are Figure 2. Capital Budgeting Techniques This figure displays CFO responses to the following question about the capital budgeting methods their companies use to make investment decisions: How frequently does your firm use the following techniques when deciding which projects or acquisitions to pursue? {0 = Never, 1, 2, 3, 4 = Always}. The percentage of firms that answer 3 or shown. The blue bars display results for the 2022 Duke CFO survey (March 2020 wave); the orange bars display results from Graham and Harvey (2001). Within each blue and orange bar, the solid portion displays responses for large firms (revenue above $1 billion), and the white, crosshatched portion displays responses for small firms (revenue below $1 billion). In 2022, for example, 77% of large firms (40% of small firms) say that they always or almost always use Net Present Value when choosing projects or making acquisitions. Net Present Value IRR/Hurdle Rate Scenario Analysis Payback ROIC ('22) Book Return ('01) P/E Multiples Profitability Index Real Options Simulation Analysis/VAR ZIZI Adjusted Present Value 0% 20% 40% 60% 80% 2022 Large ZZ Small 2001 Large ZA Small Figure 2 and Table I document that net present value (NPV) and internal rate of return (IRR) are the = Figure 5. How Do Companies Estimate the Cost of Equity? This figure displays CFO responses to the following question: How do you determine your firm's cost of equity capital? {0 = Never, 1, 2, 3, 4 = Always}. The percent who answered 3 or 4 are presented. CFOs are asked this question only if they first answered Yes to the question: Does your firm estimate the cost of equity capital? {Yes, No}. The blue bars display results for the 2022 Duke CFO survey (March 2020 wave); the orange bars display results from Graham and Harvey (2001). Within each blue and orange bar, the solid portion displays responses for large firms (revenue above $1 billion), and the white, crosshatched portion displays responses for small firms (revenue below $1 billion). In 2022, for example, 83% of large firms (29% of small firms) always or almost use the Capital Asset Pricing Model (CAPM) to estimate their firm's cost of equity capital. CAPM Multi-Factor Model Historical Average Investor Expectations Dividend Discount Model Market Return ('22 only) Regulatory Decisions Unchanged Estimate ('22 only) 0% 20% 40% 60% 80% 2022 Large ZZ Small 2001 Large V Small II.C Economic variables that explain changes in corporate investment