Question
Q1: Southdown, Inc., the nations third largest cement producer, is pushing ahead with a waste fuel burning program. The cost for Southdown will total about
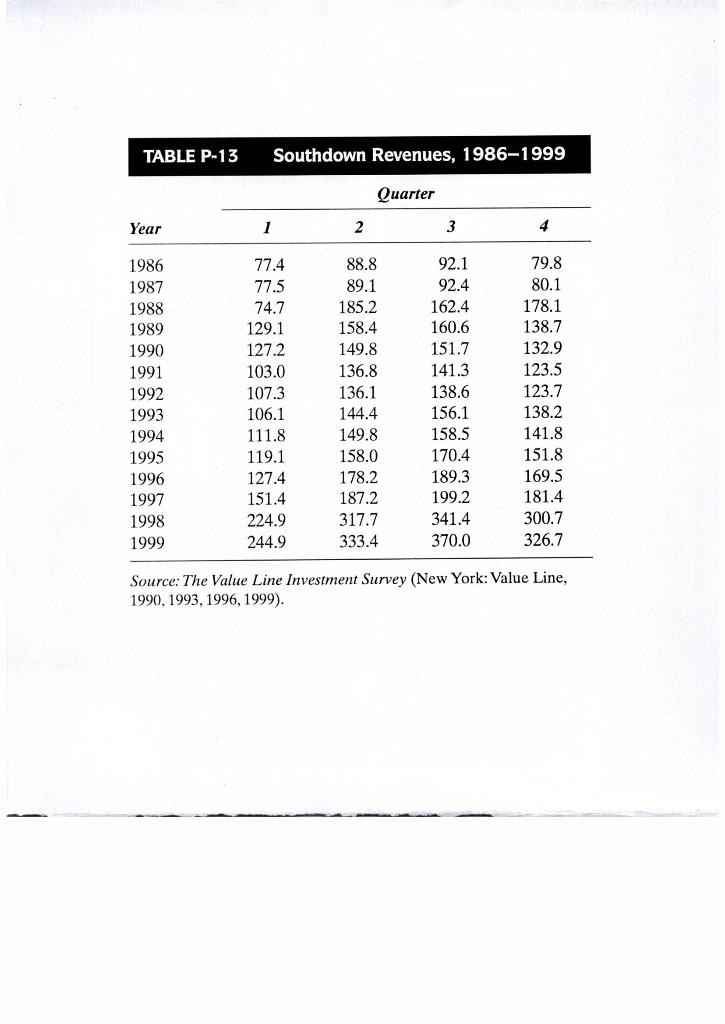
Q1: Southdown, Inc., the nations third largest cement producer, is pushing ahead with a waste fuel burning program. The cost for Southdown will total about $37 million. For this reason, it is extremely important for the company to have an accurate forecast of revenues for the first quarter of 2000. The data are presented in the table next page. Solve
i. Use exponential smoothing with a smoothing constant of .4 and an initial value of 77.4 to forecast the quarterly revenues for the first quarter of 2000.
ii. Now use a smoothing constant of .6 and an initial value of 77.4 to forecast the quarterly revenues for the first quarter of 2000.
iii. Which smoothing constant provides the better forecast? iv. Refer to part
iii. Examine the residual autocorrelations. Are you happy with simple exponential smoothing for this example? Explain. (Use a chi-square value of 30 as your reference for the LBQ test.)
v. Now apply double exponential smoothing using the optimal ARIMA constants.
vi. Examine the residual autocorrelations. Are you happy with double exponential smoothing for this example? Explain. (Use a chi-square value of 30 as your reference for the LBQ test.)
vii. Finally, apply winters method using a smoothing constant of 0.4, a trend constant of 0.1, and a seasonality constant of 0.3.
viii. Examine the residual autocorrelations. Are you happy with Winters method for this example? Explain. (Use a chi-square value of 30 as your reference for the LBQ test.)
ix. Which of the methods applied gives the best fit? Explain.
Step by Step Solution
There are 3 Steps involved in it
Step: 1

Get Instant Access to Expert-Tailored Solutions
See step-by-step solutions with expert insights and AI powered tools for academic success
Step: 2

Step: 3

Ace Your Homework with AI
Get the answers you need in no time with our AI-driven, step-by-step assistance
Get Started


