Answered step by step
Verified Expert Solution
Link Copied!

Question

1 Approved Answer

Q1. The following data are coming from a study in which students were classified into three groups based on the number of courses they failed
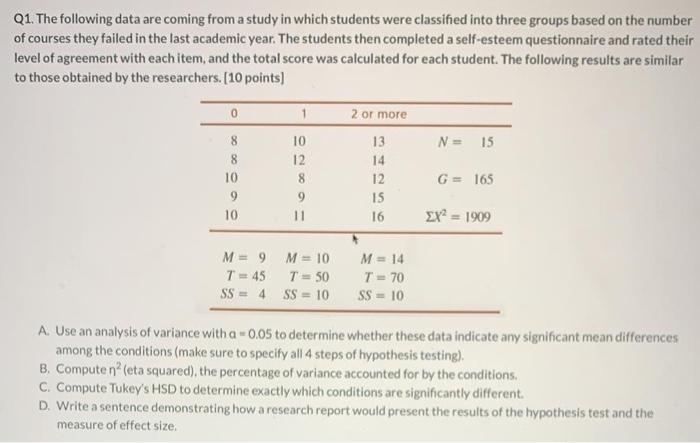
image text in transcribed
Q1. The following data are coming from a study in which students were classified into three groups based on the number of courses they failed in the last academic year. The students then completed a self-esteem questionnaire and rated their level of agreement with each item, and the total score was calculated for each student. The following results are similar to those obtained by the researchers. (10 points) 0 1 N = 15 8 8 10 10 12 8 9 11 2 or more 13 14 12 15 16 G = 165 10 2 = 1909 M = 9 M = 10 T = 45 T = 50 SS 4 SS = 10 M = 14 T = 70 SS = 10 A. Use an analysis of variance with a 0.05 to determine whether these data indicate any significant mean differences among the conditions (make sure to specify all 4 steps of hypothesis testing) B. Computen (eta squared), the percentage of variance accounted for by the conditions. C. Compute Tukey's HSD to determine exactly which conditions are significantly different D. Write a sentence demonstrating how a research report would present the results of the hypothesis test and the measure of effect size

Step by Step Solution

There are 3 Steps involved in it

Step: 1

blur-text-image

Get Instant Access to Expert-Tailored Solutions

See step-by-step solutions with expert insights and AI powered tools for academic success

Step: 2

blur-text-image

Step: 3

blur-text-image

Ace Your Homework with AI

Get the answers you need in no time with our AI-driven, step-by-step assistance

Get Started

Recommended Textbook for

Ethics Management Auditing And Developing The Ethical Content Of Organizations

Authors: S.P. Kaptein

1st Edition

0792350960, 978-0792350965

More Books

Students also viewed these Accounting questions