

Answered step by step
Verified Expert Solution
Question
1 Approved Answer
Q1/ Write a Matlab code to generate and plot the equation and the signal shown in the two branches a and b. Use time vector
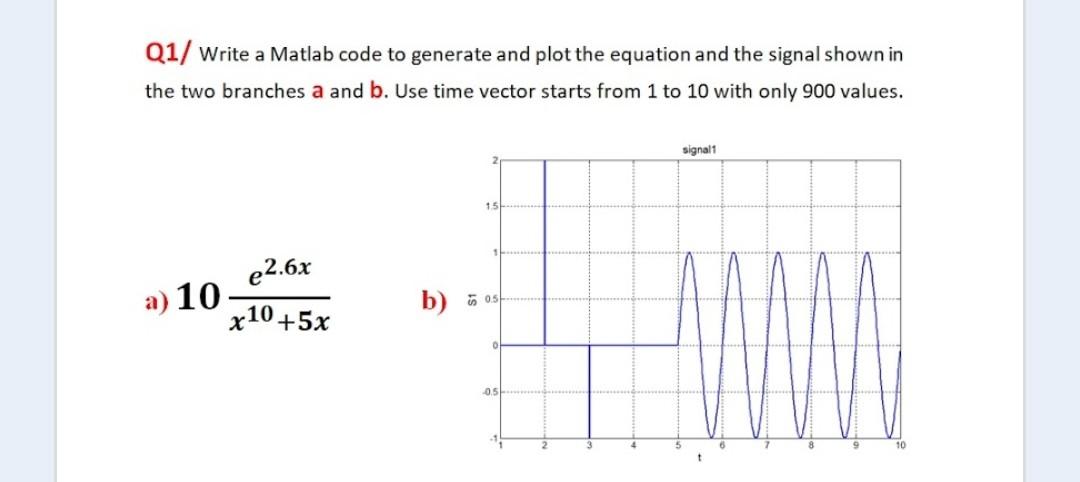
Q1/ Write a Matlab code to generate and plot the equation and the signal shown in the two branches a and b. Use time vector starts from 1 to 10 with only 900 values. signalt 1 1 e2.6x a) 10 b) Gost x10+5x 10
Step by Step Solution
There are 3 Steps involved in it
Step: 1

Get Instant Access to Expert-Tailored Solutions
See step-by-step solutions with expert insights and AI powered tools for academic success
Step: 2

Step: 3
Ace Your Homework with AI
Get the answers you need in no time with our AI-driven, step-by-step assistance
Get Started
Learn To Program Databases With Visual Basic 6
Authors: John Smiley
1st Edition
1902745035, 978-1902745039