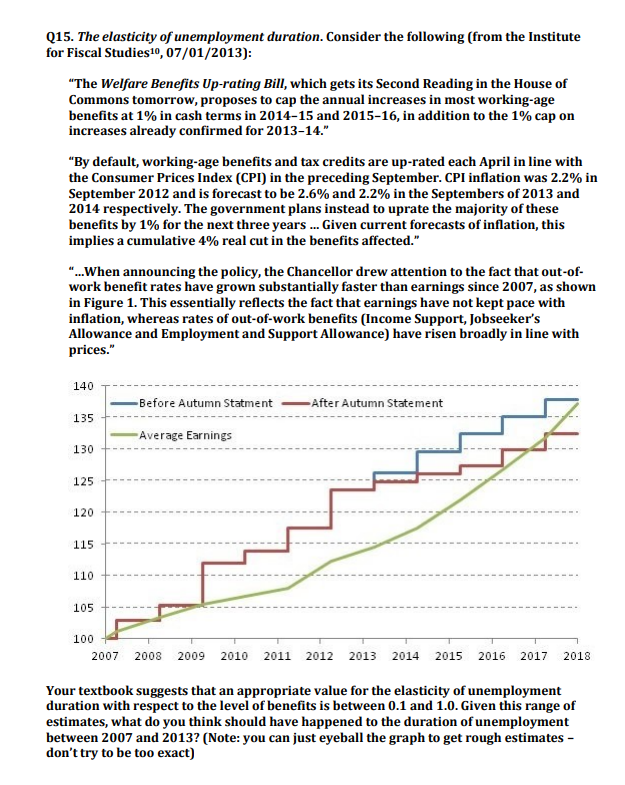
Q15. The elasticity of unemployment duration. Consider the following (from the Institute for Fiscal Studies 10,07/01/2013 ): "The Welfare Benefits Up-rating Bill, which gets its Second Reading in the House of Commons tomorrow, proposes to cap the annual increases in most working-age benefits at 1% in cash terms in 2014-15 and 2015-16, in addition to the 1% cap on increases already confirmed for 2013-14." "By default, working-age benefits and tax credits are up-rated each April in line with the Consumer Prices Index (CPI) in the preceding September. CPI inflation was 2.2% in September 2012 and is forecast to be 2.6% and 2.2% in the Septembers of 2013 and 2014 respectively. The government plans instead to uprate the majority of these benefits by 1% for the next three years ... Given current forecasts of inflation, this implies a cumulative 4% real cut in the benefits affected." "...When announcing the policy, the Chancellor drew attention to the fact that out-ofwork benefit rates have grown substantially faster than earnings since 2007, as shown in Figure 1. This essentially reflects the fact that earnings have not kept pace with inflation, whereas rates of out-of-work benefits (Income Support, Jobseeker's Allowance and Employment and Support Allowance) have risen broadly in line with prices." Your textbook suggests that an appropriate value for the elasticity of unemployment duration with respect to the level of benefits is between 0.1 and 1.0. Given this range of estimates, what do you think should have happened to the duration of unemployment between 2007 and 2013 ? (Note: you can just eyeball the graph to get rough estimates don't try to be too exact) Q15. The elasticity of unemployment duration. Consider the following (from the Institute for Fiscal Studies 10,07/01/2013 ): "The Welfare Benefits Up-rating Bill, which gets its Second Reading in the House of Commons tomorrow, proposes to cap the annual increases in most working-age benefits at 1% in cash terms in 2014-15 and 2015-16, in addition to the 1% cap on increases already confirmed for 2013-14." "By default, working-age benefits and tax credits are up-rated each April in line with the Consumer Prices Index (CPI) in the preceding September. CPI inflation was 2.2% in September 2012 and is forecast to be 2.6% and 2.2% in the Septembers of 2013 and 2014 respectively. The government plans instead to uprate the majority of these benefits by 1% for the next three years ... Given current forecasts of inflation, this implies a cumulative 4% real cut in the benefits affected." "...When announcing the policy, the Chancellor drew attention to the fact that out-ofwork benefit rates have grown substantially faster than earnings since 2007, as shown in Figure 1. This essentially reflects the fact that earnings have not kept pace with inflation, whereas rates of out-of-work benefits (Income Support, Jobseeker's Allowance and Employment and Support Allowance) have risen broadly in line with prices." Your textbook suggests that an appropriate value for the elasticity of unemployment duration with respect to the level of benefits is between 0.1 and 1.0. Given this range of estimates, what do you think should have happened to the duration of unemployment between 2007 and 2013 ? (Note: you can just eyeball the graph to get rough estimates don't try to be too exact)


