

Answered step by step
Verified Expert Solution
Question
1 Approved Answer
Q1-6 on tables 2015 2016 2014 Actual $20,613 $760 $100 Year Net sales Growth rate in net sales Cost of goods sold / net sales
Q1-6 on tables 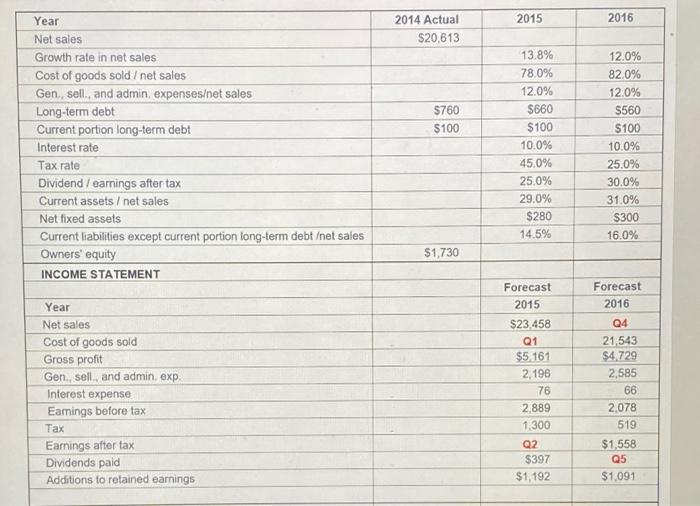
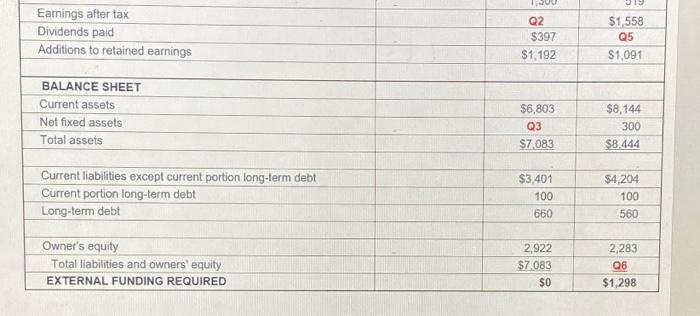
2015 2016 2014 Actual $20,613 $760 $100 Year Net sales Growth rate in net sales Cost of goods sold / net sales Gen, sell, and admin, expenseset sales Long-term debt Current portion long-term debt Interest rate Tax rate Dividend / earnings after tax Current assets / net sales Net fixed assets Current liabilities except current portion long-term debt et sales Owners' equity INCOME STATEMENT 13.8% 78.0% 12.0% $660 $100 10.0% 45.0% 25.0% 29.0% $280 14.5% 12.0% 82.0% 12.0% S560 $100 10.0% 25.0% 30.0% 31.0% $300 16.0% $1,730 Forecast 2016 Year Net sales Cost of goods sold Gross profit Gen, sell, and admin, exp. Interest expense Eamings before tax Tax Earnings after tax Dividends paid Additions to retained earnings Forecast 2015 $23.458 Q1 $5 161 2.196 76 2.889 1,300 Q4 21,543 $4.729 2,585 66 2,078 519 $1.558 Q5 $1,091 Q2 $397 $1,192 Tuy 31 Eamings after tax Dividends paid Additions to retained earnings Q2 $397 $1,192 $1,558 Q5 $1,091 BALANCE SHEET Current assets Net fixed assets Total assets $6,803 Q3 $7,083 $8,144 300 $8.444 Current liabilities except current portion long-term debt Current portion long-term debt Long-term debt $3,401 100 660 $4,204 100 560 Owner's equity Total liabilities and owners' equity EXTERNAL FUNDING REQUIRED 2.922 $7,083 $0 2,283 Q6 $1,298 Step by Step Solution
There are 3 Steps involved in it
Step: 1

Get Instant Access to Expert-Tailored Solutions
See step-by-step solutions with expert insights and AI powered tools for academic success
Step: 2

Step: 3
Ace Your Homework with AI
Get the answers you need in no time with our AI-driven, step-by-step assistance
Get Started
Debt Resisters Operations Manual
Authors: Strike Debt Strike Debt
1st Edition
1604866799, 978-1604866797