Q18
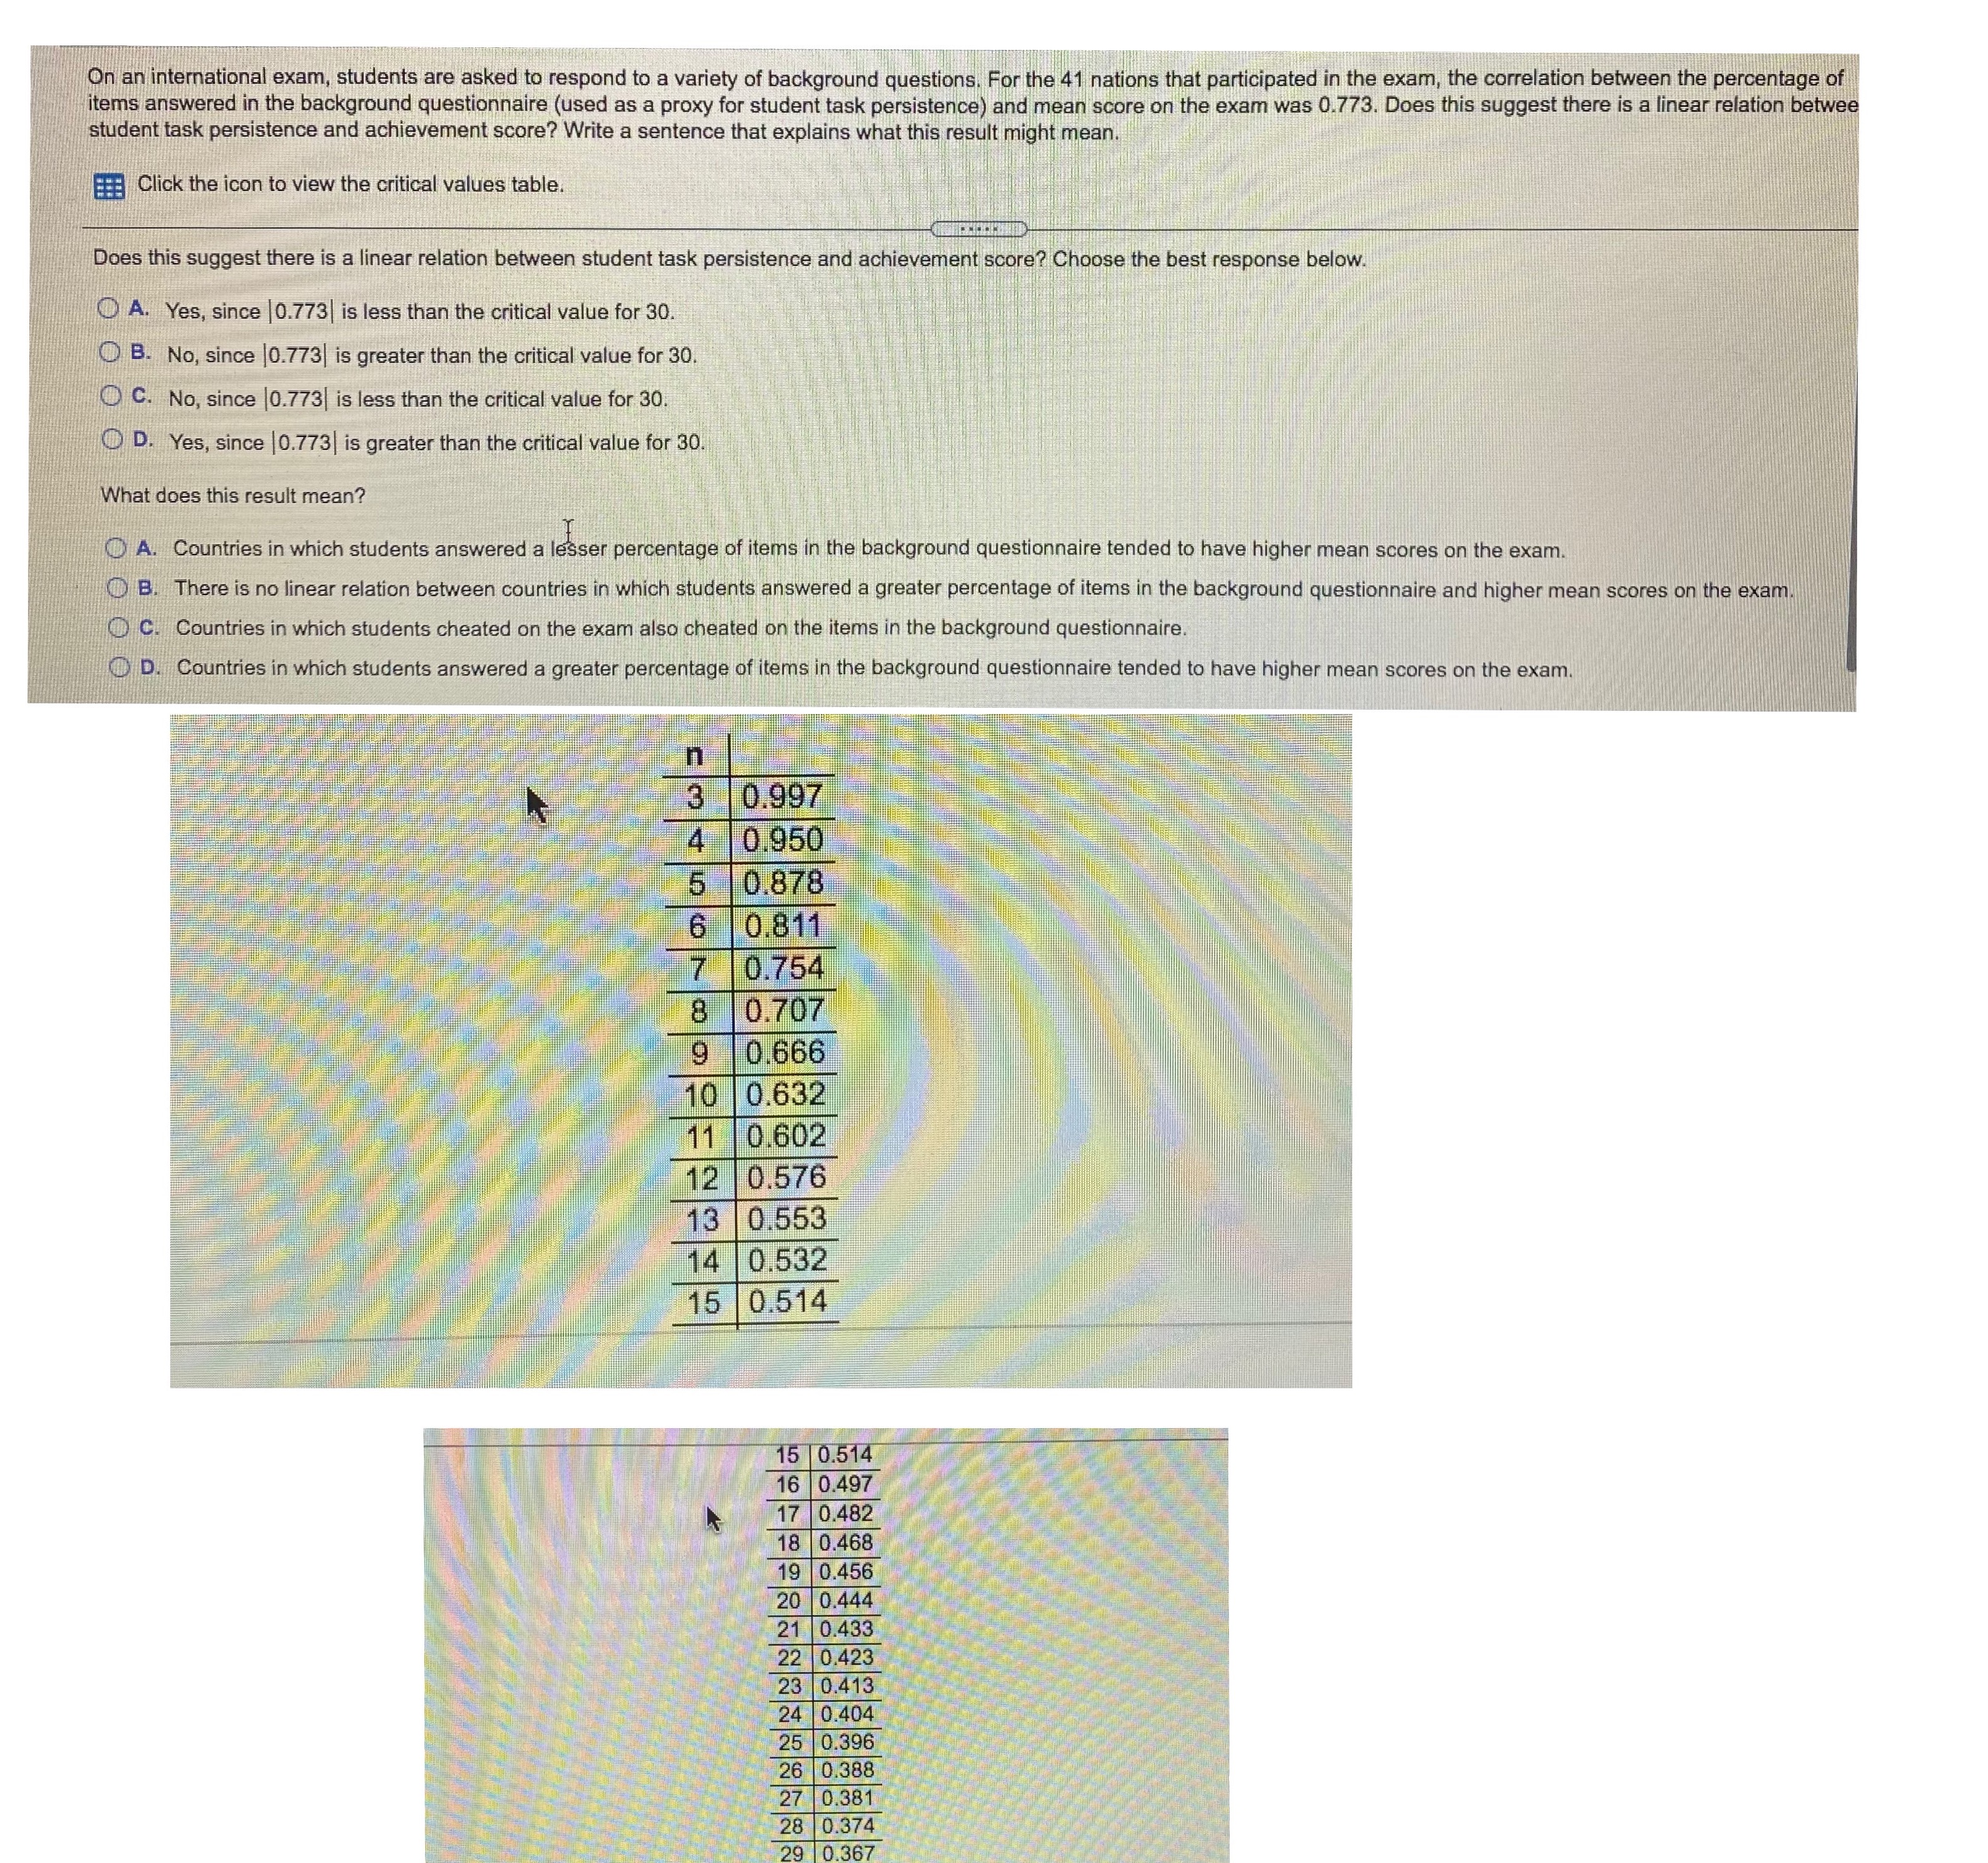
On an international exam, students are asked to respond to a variety of background questions. For the 41 nations that participated in the exam, the correlation between the percentage of items answered in the background questionnaire (used as a proxy for student task persistence) and mean score on the exam was 0.773. Does this suggest there is a linear relation betwee student task persistence and achievement score? Write a sentence that explains what this result might mean. Click the icon to view the critical values table. Does this suggest there is a linear relation between student task persistence and achievement score? Choose the best response below. O A. Yes, since |0.773| is less than the critical value for 30. D B. No, since |0.773| is greater than the critical value for 30. C. No, since |0.773| is less than the critical value for 30. D D. Yes, since |0.773| is greater than the critical value for 30. What does this result mean? O A. Countries in which students answered a lesser percentage of items in the background questionnaire tended to have higher mean scores on the exam. B. There is no linear relation between countries in which students answered a greater percentage of items in the background questionnaire and higher mean scores on the exam. C. Countries in which students cheated on the exam also cheated on the items in the background questionnaire. D. Countries in which students answered a greater percentage of items in the background questionnaire tended to have higher mean scores on the exam. n 3 0.997 4 0.950 5 0.878 6 0.811 7 0.754 8 0.707 9 0.666 10 0.632 11 0.602 12 0.576 13 0.553 14 0.532 15 0.514 15 0.514 16 0.497 17 0.482 18 0.468 19 0.456 20 0.444 21 0.433 22 0.423 23 0.413 24 0.404 25 0.396 26 0.388 27 0.381 28 0.374 1.367