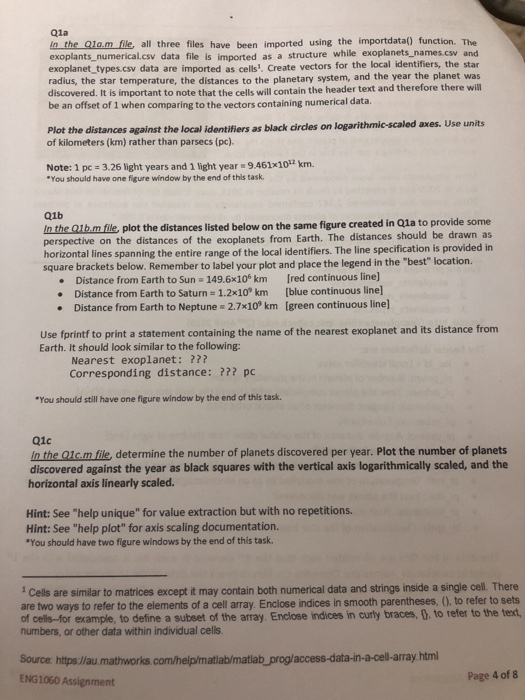
Q1a In the Qla.m file all three files have been imported using the importdata() function. The exoplants_numerical.csv data file is imported as a structure while exoplanets_names.csw and exoplanet types.csv data are imported as cells' Create vectors for the radius, the star temperature, the distances to the planetary system, and the year the planet was discovered. It is important to note that the cells will contain the header text and therefore t be an offset of 1 when comparing to the vectors containing numerical data. Plot the distances against the local identifiers as black dircles on logarithmie-scaled axes. Use units of kilometers (km) rather than parsecs (pc). Note: 1 pc 3.26 light years and 1 light year 9.461x10² km. You should have one figure window by the end of this task. 01b In the Q1bm file plot the distances listed below on the same figure created in Q1a to provide some perspective on the distances of the exoplanets from Earth. The distances should be drawn as horizontal lines spanning the entire range of the local identifiers. The line specification is provided in square brackets below. Remember to label your plot and place the legend in the "best" location. . Distance from Earth to Sun 149.6x10 km [red continuous line] .Distance from Earth to Saturn 1.2x10 km [blue continuous line Distance from Earth to Neptune 2.7x10 km (green continuous line] Use fprintf to print a statement containing the name of the nearest exoplanet and its distance from Earth. It should look similar to the following: Nearest exoplanet: ??? Corresponding distance: ??? pc You should still have one figure window by the end of this task. Q1c n the 01cm file, determine the number of planets discovered per year. Plot the number of planets discovered against the year as black squares with the vertical axis logarithmically scaled, and the horizontal axis linearly scaled Hint: See "help unique" for value extraction but with no repetitions. Hint: See "help plot" for axis scaling documentation. *You should have two figure windows by the end of this task Cells are similar to matrices except it may contain both numerical data and strings inside a single cell. There are two ways to refer to the elements of a cell array. Enclose indices in smooth parentheses, (0. to refer to sets of celis-for example, to define a subset of the array. Enclose indices in curly braces, D, to refer to the text, numbers, or other data within individual cells Source htps//au mathworks.com/help/matiab/matlab_prog/access-data-in-a-cell-array html ENG1060 Assignment Page 4 of 8 Q1a In the Qla.m file all three files have been imported using the importdata() function. The exoplants_numerical.csv data file is imported as a structure while exoplanets_names.csw and exoplanet types.csv data are imported as cells' Create vectors for the radius, the star temperature, the distances to the planetary system, and the year the planet was discovered. It is important to note that the cells will contain the header text and therefore t be an offset of 1 when comparing to the vectors containing numerical data. Plot the distances against the local identifiers as black dircles on logarithmie-scaled axes. Use units of kilometers (km) rather than parsecs (pc). Note: 1 pc 3.26 light years and 1 light year 9.461x10² km. You should have one figure window by the end of this task. 01b In the Q1bm file plot the distances listed below on the same figure created in Q1a to provide some perspective on the distances of the exoplanets from Earth. The distances should be drawn as horizontal lines spanning the entire range of the local identifiers. The line specification is provided in square brackets below. Remember to label your plot and place the legend in the "best" location. . Distance from Earth to Sun 149.6x10 km [red continuous line] .Distance from Earth to Saturn 1.2x10 km [blue continuous line Distance from Earth to Neptune 2.7x10 km (green continuous line] Use fprintf to print a statement containing the name of the nearest exoplanet and its distance from Earth. It should look similar to the following: Nearest exoplanet: ??? Corresponding distance: ??? pc You should still have one figure window by the end of this task. Q1c n the 01cm file, determine the number of planets discovered per year. Plot the number of planets discovered against the year as black squares with the vertical axis logarithmically scaled, and the horizontal axis linearly scaled Hint: See "help unique" for value extraction but with no repetitions. Hint: See "help plot" for axis scaling documentation. *You should have two figure windows by the end of this task Cells are similar to matrices except it may contain both numerical data and strings inside a single cell. There are two ways to refer to the elements of a cell array. Enclose indices in smooth parentheses, (0. to refer to sets of celis-for example, to define a subset of the array. Enclose indices in curly braces, D, to refer to the text, numbers, or other data within individual cells Source htps//au mathworks.com/help/matiab/matlab_prog/access-data-in-a-cell-array html ENG1060 Assignment Page 4 of 8


