Answered step by step
Verified Expert Solution
Link Copied!

Question

1 Approved Answer

Q2 17 Points According to the CDC, obesity rates among U.S. children have increased dramatically over the past three decades, from a low of about
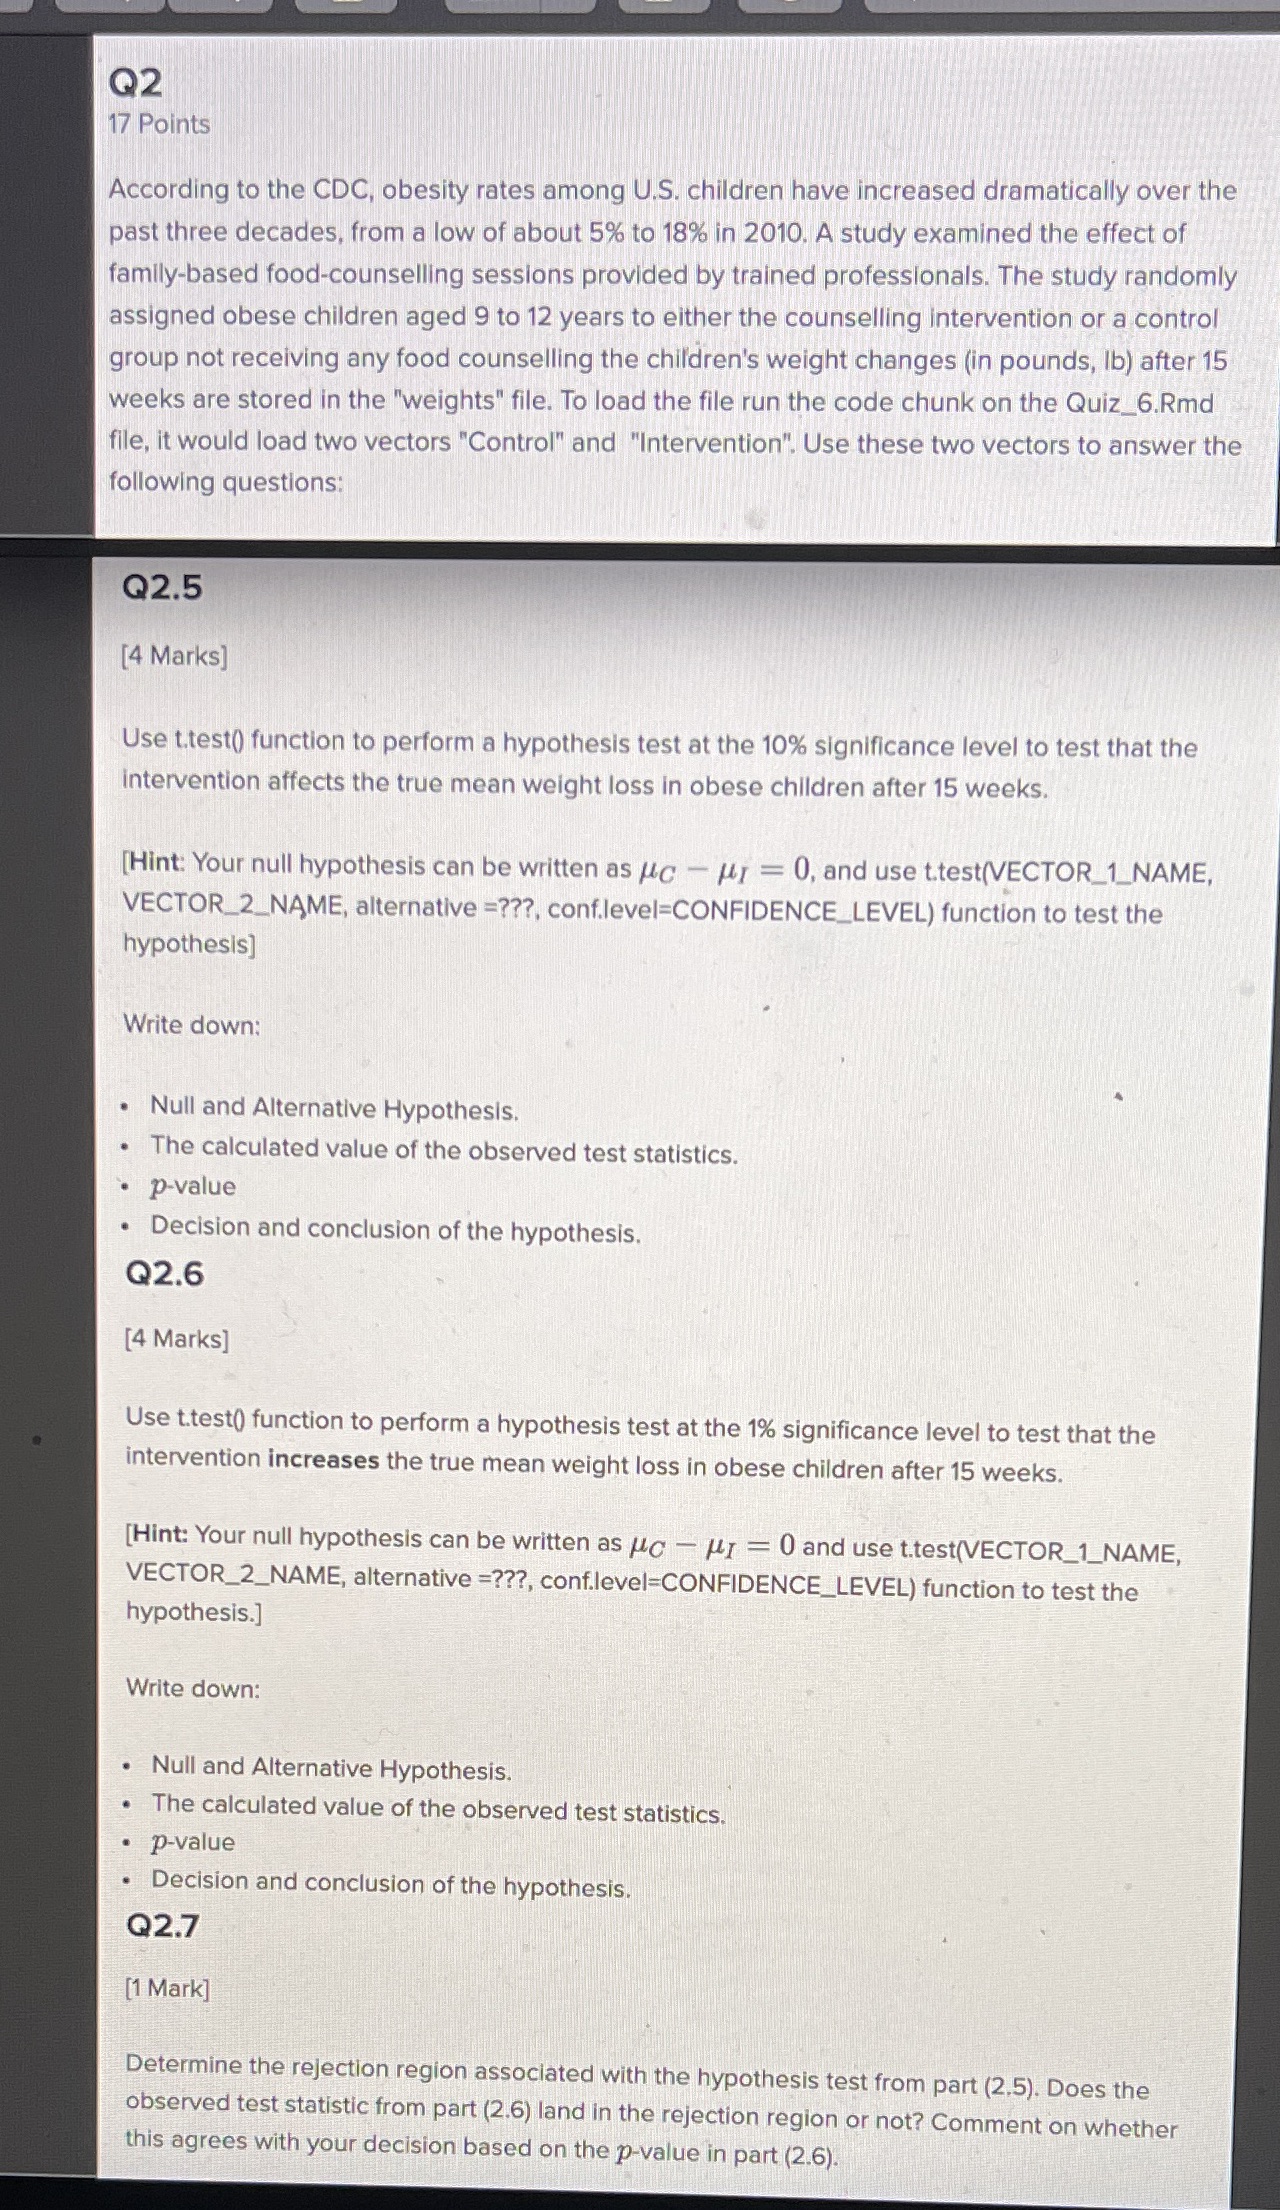
image text in transcribed
Q2 17 Points According to the CDC, obesity rates among U.S. children have increased dramatically over the past three decades, from a low of about 5% to 18% in 2010. A study examined the effect of family-based food-counselling sessions provided by trained professionals. The study randomly assigned obese children aged 9 to 12 years to either the counselling intervention or a control group not receiving any food counselling the children's weight changes (in pounds, lb) after 15 weeks are stored in the "weights" file. To load the file run the code chunk on the Quiz_6.Rmd file, it would load two vectors "Control" and "Intervention". Use these two vectors to answer the following questions: Q2.5 [4 Marks] Use t.test() function to perform a hypothesis test at the 10% significance level to test that the intervention affects the true mean weight loss in obese children after 15 weeks. [Hint: Your null hypothesis can be written as /c - My = 0, and use t.test(VECTOR_1_NAME, VECTOR_2_NAME, alternative =???, conf.level=CONFIDENCE_LEVEL) function to test the hypothesis] Write down: Null and Alternative Hypothesis. The calculated value of the observed test statistics. p-value Decision and conclusion of the hypothesis. Q2.6 [4 Marks] Use t.test() function to perform a hypothesis test at the 1% significance level to test that the intervention increases the true mean weight loss in obese children after 15 weeks. [Hint: Your null hypothesis can be written as AC - HI = 0 and use t.test(VECTOR_1_NAME, VECTOR_2_NAME, alternative =???, conf.level=CONFIDENCE_LEVEL) function to test the hypothesis.] Write down: Null and Alternative Hypothesis. The calculated value of the observed test statistics. p-value Decision and conclusion of the hypothesis. Q2.7 [1 Mark] Determine the rejection region associated with the hypothesis test from part (2.5). Does the observed test statistic from part (2.6) land in the rejection region or not? Comment on whether this agrees with your decision based on the p-value in part (2.6)

Step by Step Solution

There are 3 Steps involved in it

Step: 1

blur-text-image

Get Instant Access to Expert-Tailored Solutions

See step-by-step solutions with expert insights and AI powered tools for academic success

Step: 2

blur-text-image

Step: 3

blur-text-image

Ace Your Homework with AI

Get the answers you need in no time with our AI-driven, step-by-step assistance

Get Started

Recommended Textbook for

Applied Calculus

Authors: Stefan Waner, Steven Costenoble

7th Edition

1337514306, 9781337514309

More Books

Students also viewed these Mathematics questions

Question

why we face Listening Challenges?

Answered: 1 week ago

Question

what is Listening in Context?

Answered: 1 week ago