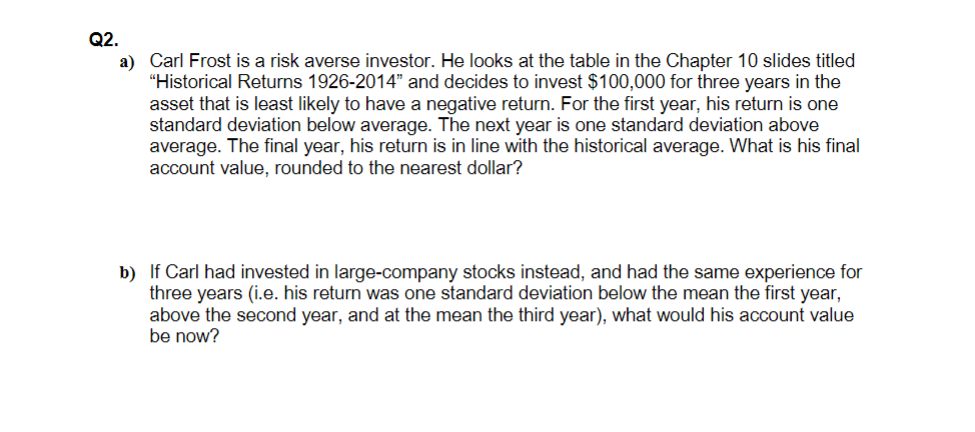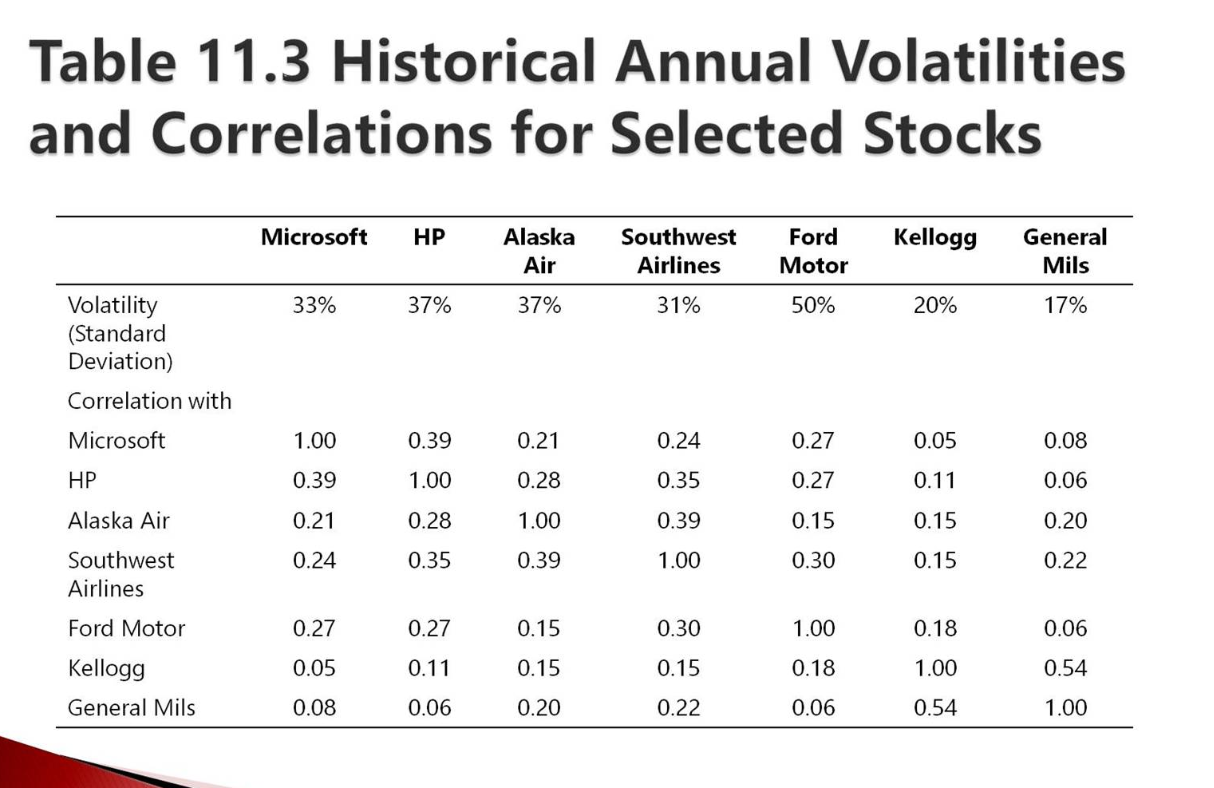

Q2. a) Carl Frost is a risk averse investor. He looks at the table in the Chapter 10 slides titled Historical Returns 1926-2014" and decides to invest $100,000 for three years in the asset that is least likely to have a negative return. For the first year, his return is one standard deviation below average. The next year is one standard deviation above average. The final year, his return is in line with the historical average. What is his final account value, rounded to the nearest dollar? b) If Carl had invested in large-company stocks instead, and had the same experience for three years (i.e. his return was one standard deviation below the mean the first year, above the second year, and at the mean the third year), what would his account value be now? Table 11.3 Historical Annual Volatilities and Correlations for Selected Stocks Microsoft HP Alaska Air 37% Southwest Airlines Kellogg Ford Motor 50% General Mils 33% 37% 31% 20% 17% Volatility (Standard Deviation) Correlation with Microsoft 0.39 0.21 0.27 0.05 HP 0.28 0.27 1.00 0.39 0.21 0.24 0.24 0.35 0.39 0.11 1.00 0.28 0.08 0.06 0.20 Alaska Air 1.00 0.15 0.15 0.30 0.35 0.39 1.00 0.15 0.22 Southwest Airlines Ford Motor Kellogg General Mils 0.27 0.15 0.30 0.06 0.27 0.05 0.08 0.11 0.15 0.15 1.00 0.18 0.06 0.18 1.00 0.54 0.54 0.06 0.20 0.22 1.00 Q2. a) Carl Frost is a risk averse investor. He looks at the table in the Chapter 10 slides titled Historical Returns 1926-2014" and decides to invest $100,000 for three years in the asset that is least likely to have a negative return. For the first year, his return is one standard deviation below average. The next year is one standard deviation above average. The final year, his return is in line with the historical average. What is his final account value, rounded to the nearest dollar? b) If Carl had invested in large-company stocks instead, and had the same experience for three years (i.e. his return was one standard deviation below the mean the first year, above the second year, and at the mean the third year), what would his account value be now? Table 11.3 Historical Annual Volatilities and Correlations for Selected Stocks Microsoft HP Alaska Air 37% Southwest Airlines Kellogg Ford Motor 50% General Mils 33% 37% 31% 20% 17% Volatility (Standard Deviation) Correlation with Microsoft 0.39 0.21 0.27 0.05 HP 0.28 0.27 1.00 0.39 0.21 0.24 0.24 0.35 0.39 0.11 1.00 0.28 0.08 0.06 0.20 Alaska Air 1.00 0.15 0.15 0.30 0.35 0.39 1.00 0.15 0.22 Southwest Airlines Ford Motor Kellogg General Mils 0.27 0.15 0.30 0.06 0.27 0.05 0.08 0.11 0.15 0.15 1.00 0.18 0.06 0.18 1.00 0.54 0.54 0.06 0.20 0.22 1.00


