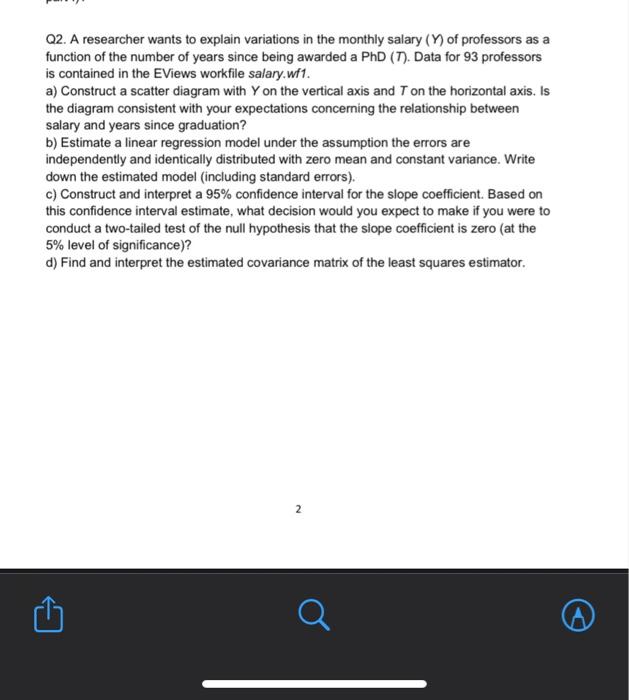
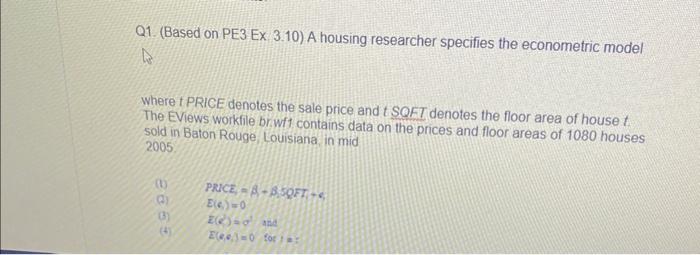
Q2. A researcher wants to explain variations in the monthly salary (Y) of professors as a function of the number of years since being awarded a PhD (T). Data for 93 professors is contained in the EViews workfile salary.wit. a) Construct a scatter diagram with Y on the vertical axis and T on the horizontal axis. Is the diagram consistent with your expectations concerning the relationship between salary and years since graduation? b) Estimate a linear regression model under the assumption the errors are independently and identically distributed with zero mean and constant variance. Write down the estimated model (including standard errors). c) Construct and interpret a 95% confidence interval for the slope coefficient. Based on this confidence interval estimate, what decision would you expect to make if you were to conduct a two-tailed test of the null hypothesis that the slope coefficient is zero (at the 5% level of significance)? d) Find and interpret the estimated covariance matrix of the least squares estimator. Q1. (Based on PE3 Ex 3.10) A housing researcher specifies the econometric model Where t PRICE denotes the sale price and t SQFT denotes the floor area of house t The EViews workfile briwft contains data on the prices and floor areas of 1080 houses sold in Baton Rouge, Louisiana, in mid 2005 (1) PACE,=AB,5QFT+s (4) E()=0 (3) z(2)=q and (t) E(c,e)=0 for )= ? Q2. A researcher wants to explain variations in the monthly salary (Y) of professors as a function of the number of years since being awarded a PhD (T). Data for 93 professors is contained in the EViews workfile salary.wit. a) Construct a scatter diagram with Y on the vertical axis and T on the horizontal axis. Is the diagram consistent with your expectations concerning the relationship between salary and years since graduation? b) Estimate a linear regression model under the assumption the errors are independently and identically distributed with zero mean and constant variance. Write down the estimated model (including standard errors). c) Construct and interpret a 95% confidence interval for the slope coefficient. Based on this confidence interval estimate, what decision would you expect to make if you were to conduct a two-tailed test of the null hypothesis that the slope coefficient is zero (at the 5% level of significance)? d) Find and interpret the estimated covariance matrix of the least squares estimator. Q1. (Based on PE3 Ex 3.10) A housing researcher specifies the econometric model Where t PRICE denotes the sale price and t SQFT denotes the floor area of house t The EViews workfile briwft contains data on the prices and floor areas of 1080 houses sold in Baton Rouge, Louisiana, in mid 2005 (1) PACE,=AB,5QFT+s (4) E()=0 (3) z(2)=q and (t) E(c,e)=0 for )=


