Question
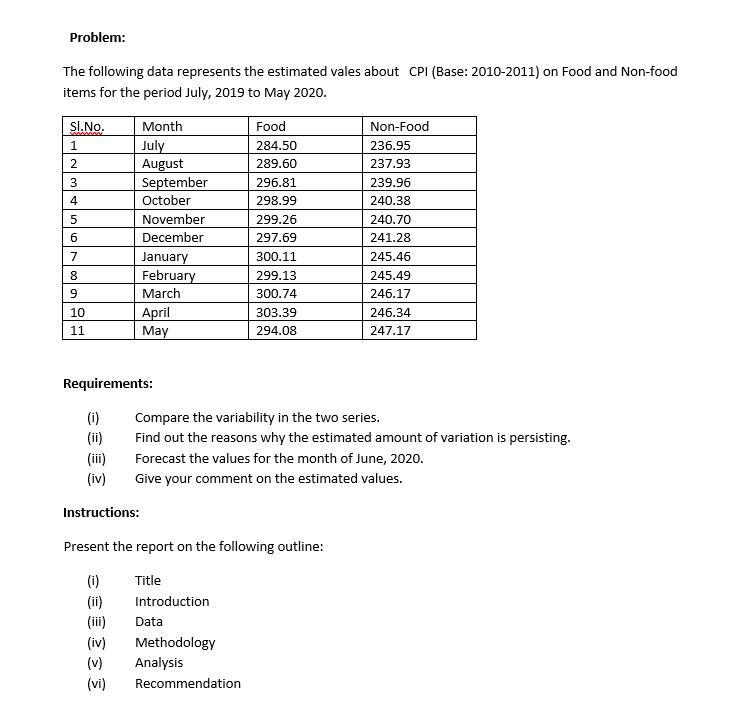
Problem: The following data represents the estimated vales about CPI (Base: 2010-2011) on Food and Non-food items for the period July, 2019 to May

Problem: The following data represents the estimated vales about CPI (Base: 2010-2011) on Food and Non-food items for the period July, 2019 to May 2020. Sl.No. 1 2 3 4 5 6 7 8 9 10 11 Month July August September October November December (iii) (iv) Instructions: January February March April May Requirements: (i) (ii) Food 284.50 289.60 296.81 298.99 299.26 297.69 300.11 299.13 300.74 303.39 294.08 Non-Food 236.95 237.93 Present the report on the following outline: (i) Title (ii) Introduction (iii) Data (iv) Methodology (v) Analysis (vi) Recommendation 239.96 240.38 240.70 241.28 245.46 245.49 246.17 Compare the variability in the two series. Find out the reasons why the estimated amount of variation is persisting. Forecast the values for the month of June, 2020. Give your comment on the estimated values. 246.34 247.17
Step by Step Solution
There are 3 Steps involved in it
Step: 1

Get Instant Access to Expert-Tailored Solutions
See step-by-step solutions with expert insights and AI powered tools for academic success
Step: 2

Step: 3

Ace Your Homework with AI
Get the answers you need in no time with our AI-driven, step-by-step assistance
Get StartedRecommended Textbook for
Business Statistics
Authors: Robert A. Donnelly
2nd Edition
0321925122, 978-0321925121
Students also viewed these Accounting questions
Question
Answered: 1 week ago
Question
Answered: 1 week ago
Question
Answered: 1 week ago
Question
Answered: 1 week ago
Question
Answered: 1 week ago
Question
Answered: 1 week ago
Question
Answered: 1 week ago
Question
Answered: 1 week ago
Question
Answered: 1 week ago
Question
Answered: 1 week ago
Question
Answered: 1 week ago
Question
Answered: 1 week ago
Question
Answered: 1 week ago
Question
Answered: 1 week ago
Question
Answered: 1 week ago
Question
Answered: 1 week ago
Question
Answered: 1 week ago
Question
Answered: 1 week ago
Question
Answered: 1 week ago
Question
Answered: 1 week ago
Question
Answered: 1 week ago
Question
Answered: 1 week ago
View Answer in SolutionInn App


